Showing posts sorted by relevance for query gcta. Sort by date Show all posts

Friday, January 01, 2016

GCTA, Missing Heritability, and All That

New Update: Yang, Visscher et al. respond here.

Update: see detailed comments and analysis here and here by Sasha Gusev. Gusev claims that the problems identified in Figs 4,7 are the result of incorrect calculation of the SE (4) and failure to exclude related individuals in the Framingham data (7).


Bioinformaticist E. Stovner asked about a recent PNAS paper which is critical of GCTA. My comments are below.

It's a shame that we don't have a better online platform (e.g., like Quora or StackOverflow) for discussing scientific papers. This would allow the authors of a paper to communicate directly with interested readers, immediately after the paper appears. If the authors of this paper want to correct my misunderstandings, they are welcome to comment here!
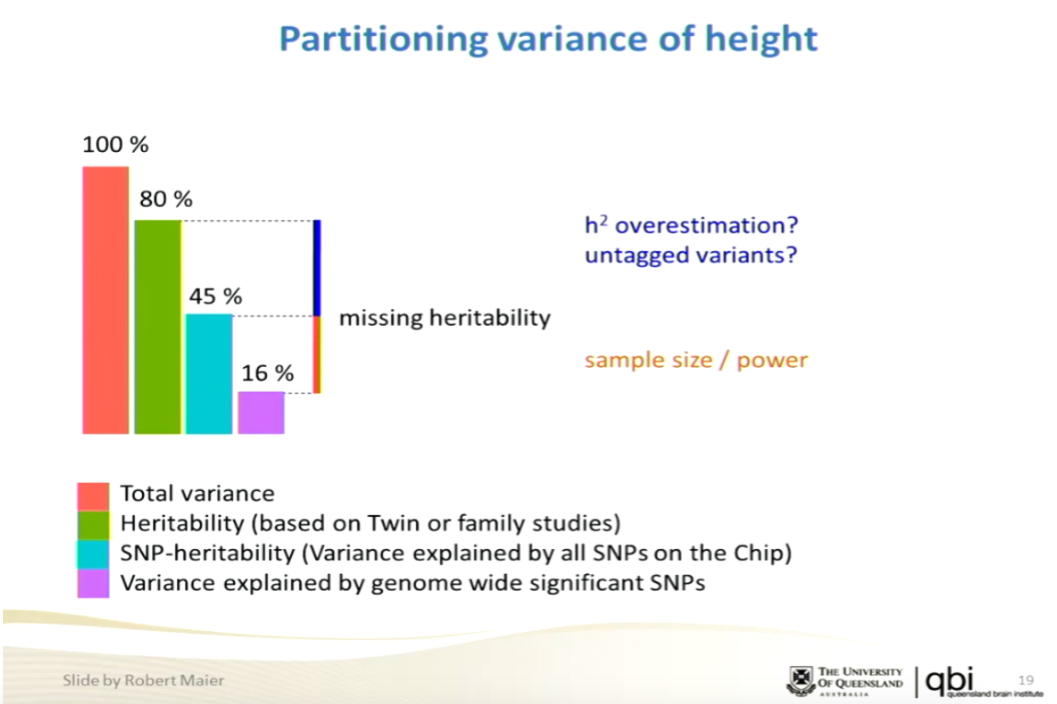
I took a quick look at it. My guess is that Visscher et al. will respond to the paper. It has not changed my opinion of GCTA. Note I have always thought the standard errors quoted for GCTA are too optimistic, as the method makes strong assumptions (e.g., fits a model with Gaussian random effect sizes). But directionally it is obvious that total h2 accounted for by all common SNPs is much larger than what you get from only genome wide significant hits obtained in early studies. For example, the number of genome wide significant hits for some traits (e.g., height) has been growing steadily, along with h2 accounted for using just those hits, eventually approaching the GCTA prediction. That is, even *without* GCTA the steady progress of GWAS shows that common variants account for significant heritability (amount of "missing" heritability steadily declines with GWAS sample size), so the precise reliability of GCTA becomes less important.

Regarding this paper, they make what sound like strong theoretical points in the text, but the simulation results don't seem to justify the aggressive rhetoric. The only point they really make in figs 4,7 is that the error estimate from GCTA in the case where SNP coverage is inadequate (i.e., using 5k out of 50k SNPs) are way off. But this doesn't correspond to any real world study that we care about. Real world results show that as you approach ~few x 100k SNPs used the h2 result asymptotes (approaches its limiting value), because you have enough coverage of common variants. The authors of the paper seem confused about this point -- see "Saturation of heritability estimates" section.

What they should do is simulate repeatedly with multiple disjoint populations (using good SNP coverage) and see how the heritability results fluctuate. But I think that kind of calculation has been done by other people and does not show large fluctuations in h2.

Well, since you got me to write this much already I suppose I should promote this to an actual blog post at some point ... Please keep in mind that I've only given the paper a quick read so I might be missing something important. Happy New Year!
Here is the paper:
Limitations of GCTA as a solution to the missing heritability problem
http://www.pnas.org/content/early/2015/12/17/1520109113

The genetic contribution to a phenotype is frequently measured by heritability, the fraction of trait variation explained by genetic differences. Hundreds of publications have found DNA polymorphisms that are statistically associated with diseases or quantitative traits [genome-wide association studies (GWASs)]. Genome-wide complex trait analysis (GCTA), a recent method of analyzing such data, finds high heritabilities for such phenotypes. We analyze GCTA and show that the heritability estimates it produces are highly sensitive to the structure of the genetic relatedness matrix, to the sampling of phenotypes and subjects, and to the accuracy of phenotype measurements. Plausible modifications of the method aimed at increasing stability yield much smaller heritabilities. It is essential to reevaluate the many published heritability estimates based on GCTA.
It's important to note that although GCTA fits a model with random effects, it purports to estimate the heritability of more realistic genetic architectures with some other (e.g., sparse) distribution of effect sizes (see Lee and Chow paper at bottom of this post). The authors of this PNAS paper seem to take the random effects assumption more seriously than the GCTA originators themselves. The latter fully expected a saturation effect once enough SNPs are used; the former seem to think it violates the fundamental nature of the model. Indeed, AFAICT, the toy models in the PNAS simulations assume all 50k SNPs affect the trait, and they run simulations where only 5k at a time are included in the computation. This is likely the opposite of the real world situation, in which a relatively small number (e.g., ~10k SNPs) affect the trait, and by using a decent array with > 200k SNPs one already obtains sensitivity to the small subset.

One can easily show that genetic architectures of complex traits tend to be sparse: most of the heritability is accounted for by a small subset of alleles. (Here "small" means a small fraction of ~ millions of SNPs: e.g., 10k SNPs.) See section 3.2 of On the genetic architecture of intelligence and other quantitative traits for an explanation of how to roughly estimate the sparsity using genetic Hamming distances. In our work on Compressed Sensing applied to genomics, we showed that much of the heritability for many complex traits can be recovered if sample sizes of order millions are available for analysis. Once these large data sets are available, this entire debate about missing heritability and GCTA heritability estimates will recede in importance. (See talk and slides here.)

For more discussion, see Why does GCTA work?
This paper, by two of my collaborators, examines the validity of a recently introduced technique called GCTA (Genome-wide Complex Trait Analysis). GCTA allows an estimation of heritability due to common SNPs using relatively small sample sizes (e.g., a few thousand genotype-phenotype pairs). The new method is independent of, but delivers results consistent with, "classical" methods such as twin and adoption studies. To oversimplify, it examines pairs of unrelated individuals and computes the correlation between pairwise phenotype similarity and genotype similarity (relatedness). It has been applied to height, intelligence, and many medical and psychiatric conditions.

When the original GCTA paper (Common SNPs explain a large proportion of the heritability for human height) appeared in Nature Genetics it stimulated quite a lot of attention. But I was always uncertain of the theoretical justification for the technique -- what are the necessary conditions for it to work? What are conservative error estimates for the derived heritability? My impression, from talking to some of the authors, is that they had a mainly empirical view of these questions. The paper below elaborates significantly on the theory behind GCTA. 
Conditions for the validity of SNP-based heritability estimation

James J Lee, Carson C Chow
doi: 10.1101/003160

...

Sunday, February 21, 2016

Missing Heritability and GCTA: Update on PNAS dispute

GCTA is a statistical method for estimating the heritability of a complex trait using (phenotype | genotype) data from unrelated individuals. It has been applied to many human phenotypes, including disease conditions and behavioral traits. GCTA results tend to be consistent with earlier twin and family studies of heritability, and suggest that significant heritability is due to common genetic variants that will be identified in the future through increased statistical power (sample size).

A recent PNAS paper by researchers at Stanford claims to identify many problems with GCTA. The conclusions of this paper have been hotly contested by the GCTA authors and others.
Earlier post (January 1, 2016) on PNAS paper Limitations of GCTA as a solution to the missing heritability problem. (See also: many posts on this blog which mention GCTA.)

Detailed comments and analysis here and here by Sasha Gusev. Gusev claims that the problems identified in Figs 4,7 are the result of incorrect calculation of the SE (4) and failure to exclude related individuals in the Framingham data (7).

GCTA authors Visscher, Yang, et al. respond to PNAS paper -- they accept none of the criticisms (February 13, 2016 biorxiv).

PNAS authors reply to Visscher, Yang, et al. comments (February 16, 2016 bioarxiv). They claim that relatedness thresholding used with GCTA analysis is flawed and that residual standard errors are much larger than claimed.

Gamazon and Park (February 18, 2016 bioarxiv) question spectral analysis and random matrix theory results in the PNAS paper. (I believe this is the first critique which looks at the mathematics of the PNAS paper, as opposed to simulation results.)
This dispute shows the utility of blogs (Gusev) and biorxiv for rapid scientific discussion. Some of the commentaries listed above are 20+ pages long with figures and equations. This discussion would not have been possible (or would have taken months or years) in a journal setting.

The next step should be a mini-workshop conducted online, with each group allowed 30 min to present their results, followed by questions :-)


I've always felt that the real weakness of GCTA is the assumption of random effects. A consequence of this assumption is that if the true causal variants are atypical (e.g., in terms of linkage disequilibrium) among common SNPs, the results could be biased. It is impossible to evaluate this uncertainty at the moment because we do not yet know the genetic architectures of any complex traits. See Why does GCTA work? for more discussion and a link to work by Lee and Chow examining this issue.

Recently, a promising new method (Heritability Estimates from Summary Statistics) has been proposed which does not make assumptions about the effect size distribution -- it uses GWAS estimates of effect size to directly estimate variance accounted for by each region of the genome. The initial application of this method also suggests significant heritability due to common variants.

The broader debate over whether common variants will eventually account for significant heritability in many complex traits has been going on for years now. The centrality of GCTA results to this question decreases by the year as more and more heritability is accounted for by specific loci identified at genome wide significance in well-powered GWAS. For example, this slide (see talk on genomic prediction I gave in 2015 at NIH and HLI) shows that GWAS hits on height now account for 16% of total variance. That means a predictor could be constructed with correlation ~0.4 to the actual trait. I think the argument is basically over, unless you have some ulterior motive for denying the potential of genomic prediction.

Saturday, September 10, 2016

Speed, Balding, et al.: "for a wide range of traits, common SNPs tag a greater fraction of causal variation than is currently appreciated"

I recently blogged about a nice lecture by David Balding at the 2015 MLPM (Machine Learning for Personalized Medicine) Summer School: Machine Learning for Personalized Medicine: Heritability-based models for prediction of complex traits. In that talk he discussed some results concerning heritability estimation and potential improvements over GCTA. A new preprint on bioRxiv has the details:
Re-evaluation of SNP heritability in complex human traits

Doug Speed, Na Cai, The UCLEB Consortium, Michael Johnson, Sergey Nejentsev, David Balding
http://dx.doi.org/10.1101/074310

SNP heritability, the proportion of phenotypic variance explained by SNPs, has been estimated for many hundreds of traits, and these estimates are being used to explore genetic architecture and guide future research. To estimate SNP heritability requires strong assumptions about how heritability is distributed across the genome, but the assumptions in current use have not been thoroughly tested. By analyzing imputed data for 42 human traits, we empirically derive an improved model for heritability estimation. It is commonly assumed that the expected heritability of a SNP does not depend on its allele frequency; we instead identify a more realistic relationship which reflects that heritability tends to decrease with minor allele frequency. Two methods for estimating SNP heritability, GCTA and LDAK, make contrasting assumptions about how heritability varies with linkage disequilibrium; we demonstrate that the model used by LDAK better reflects the properties of real data. Additionally, we show how genotype certainty can be incorporated in the heritability model; this enables the inclusion of poorly-imputed SNPs, which can capture substantial extra heritability. Our revised method typically results in substantially higher estimates of SNP heritability: for example, across 19 traits (mainly diseases), the estimates based on common SNPs (minor allele frequency >0.01) are on average 40% (SD 3) higher than those obtained using original GCTA, and 25% (SD 2) higher than those from the recently-proposed extension GCTA-LDMS. We conclude that for a wide range of traits, common SNPs tag a greater fraction of causal variation than is currently appreciated. When we also include rare SNPs (minor allele frequency <0.01), we find that across 23 quantitative traits, estimates of SNP heritability increase by on average 29% (SD 12), and that rare SNPs tend to contribute about half the heritability of common SNPs.
In contrast to GCTA, which assumes a uniform Gaussian distribution of effect sizes for each SNP, this paper considers effect sizes which depend on the local linkage disequilibrium in a particular region w_j, as well as a SNP quality score r_j. (See equation 1 of the paper.) The intuition behind w_j is that if there are n SNPs in a small region which are all highly correlated, they are likely to all be proxies for the actual causal variant, and hence one might over count its contribution by assigning nearly equal effects to each of the SNPs. Instead, the method proposed in this paper (roughly) splits the effect size among the SNPs (Figure 1 below). Their model also allows the effect size distribution to depend on the MAF of j: SNPs at lower frequency in the population contribute less to heritability than in the GCTA default assumption.


The resulting heritability estimates tend to be higher than from GCTA
, so if this method is an improvement (as the authors argue), the amount of missing heritability is even less than that found in GCTA.

Supplement Figure 21 (p.26) provides yet more criticism of Kumar et al., a paper we discussed previously here. [Kumar, S., Feldman, M., Rehkopf, D. & Tuljapurkar, S. Limitations of GCTA as a solution to the missing heritability problem, PNAS 113, E61E70 (2015).]

Saturday, September 14, 2013

Pleiotropy, g, and specific learning abilities

This came out earlier in the year but I just noticed it. See also Myths, Sisyphus and g.

Summary for those wishing to follow science but who can't do math: consider many pairs of individuals and ask to what extent similarity in genotype is related to similarity in phenotype (g score, specific ability score, height, weight, etc.). From this analysis one can estimate the extent to which genes influence phenotype (heritability), and to what extent the same genes are influencing two different traits (e.g., height and weight, or reading ability and general cognitive ability g). The bivariate method is described here in more detail.

"These results indicate that genes related to diverse neurocognitive processes have general rather than specific effects."
DNA Evidence for Strong Genome-Wide Pleiotropy of Cognitive and Learning Abilities  (DOI 10.1007/s10519-013-9594-x Behavior Genetics)

Abstract: Very different neurocognitive processes appear to be involved in cognitive abilities such as verbal and non-verbal ability as compared to learning abilities taught in schools such as reading and mathematics. However, twin studies that compare similarity for monozygotic and dizygotic twins suggest that the same genes are largely responsible for genetic influence on these diverse aspects of cognitive function. It is now possible to test this evidence for strong pleiotropy using DNA alone from samples of unrelated individuals. Here we used this new method with 1.7 million DNA markers for a sample of 2,500 unrelated children at age 12 to investigate for the first time the extent of pleiotropy between general cognitive ability (aka intelligence) and learning abilities (reading, mathematics and language skills). We also compared these DNA results to results from twin analyses using the same sample and measures. The DNA-based method revealed strong genome-wide pleiotropy: Genetic correlations were greater than 0.70 between general cognitive ability and language, reading, and mathematics, results that were highly similar to twin study estimates of genetic correlations. These results indicate that genes related to diverse neurocognitive processes have general rather than specific effects. 

[GCTA] ... The bivariate method extends the univariate model by relating the pairwise genetic similarity matrix to a phenotypic covariance matrix between traits 1 and 2 (Lee et al. 2012). The eight principal components described earlier were used as covariates in our bivariate GCTA analyses; as mentioned in the previous section, all phenotypes were age- and sex-regressed prior to analysis.

Twin modelling. The twin design and model-fitting is discussed elsewhere (Plomin et al. 2013a). We fit a bivariate Cholesky decomposition using OpenMx (Boker et al. 2011), which provided a direct comparison with the bivariate GCTA. The correlated factor solution is the least restricted model allowing variables to correlate with one another via genetic, shared environment, and non-shared environment.

... Table 1 shows GCTA-estimated genetic correlations (and standard errors, SE) between ‘g’ and learning abilities for more than 2,238 12-year-old UK twins (randomly selecting only one member of each twin pair to control for potential confounds, such as birth order) based on 1.7 million SNPs measured from the Affymetrix 6.0 GeneChip or imputed from HapMap 2,3 and WTCCC controls (Trzaskowski et al. 2013). Genetic correlations are significant and substantial for all three comparisons—between ‘g’ and language (0.81), mathematics (0.74), and reading (0.89). The GCTA-estimated genetic correlations between ‘g’ and learning abilities are similar in magnitude to the GCTA-estimated genetic correlation between height and weight (0.76). In addition, Table 1 includes bivariate results for ‘g’ versus height and ‘g’ versus weight as ‘negative controls’; their phenotypic correlations are both 0.07. As expected, these comparisons yielded negligible and nonsignificant genetic correlations (−0.03 and −0.06, respectively).

... A more novel question, and central to the present paper, is why, as we have shown here, bivariate genetic correlations estimated by GCTA are as great as twin study estimates. The likely reason is that attenuation of the estimated additive genetic variance due to imperfect linkage disequilibrium between causal variants and genotyped SNPs applies to both the additive genetic variance of the two traits and to their additive genetic covariance by the same proportion. Thus, the GCTA estimate of the genetic correlation is unbiased because it is derived from the ratio between genetic covariance and the genetic variances of the two traits.

Are generalist genes all in the mind (cognition) or are they in the brain as well? That is, genetic correlations between cognitive and learning abilities might be epiphenomenal in the sense that multiple genetically independent brain mechanisms could affect each ability, creating genetic correlations among abilities. However, the genetic principles of pleiotropy (each gene affects many traits) and polygenicity (many genes affect each trait) lead us to predict that generalist genes have their effects further upstream, creating genetic correlations among brain structures and functions, a prediction that supports a network view of brain structure and function.


Sunday, March 30, 2014

Why does GCTA work?

This paper, by two of my collaborators, examines the validity of a recently introduced technique called GCTA (Genome-wide Complex Trait Analysis). GCTA allows an estimation of heritability due to common SNPs using relatively small sample sizes (e.g., a few thousand genotype-phenotype pairs). The new method is independent of, but delivers results consistent with, "classical" methods such as twin and adoption studies. To oversimplify, it examines pairs of unrelated individuals and computes the correlation between pairwise phenotype similarity and genotype similarity (relatedness). It has been applied to height, intelligence, and many medical and psychiatric conditions.

When the original GCTA paper (Common SNPs explain a large proportion of the heritability for human height) appeared in Nature Genetics it stimulated quite a lot of attention. But I was always uncertain of the theoretical justification for the technique -- what are the necessary conditions for it to work? What are conservative error estimates for the derived heritability? My impression, from talking to some of the authors, is that they had a mainly empirical view of these questions. The paper below elaborates significantly on the theory behind GCTA.
Conditions for the validity of SNP-based heritability estimation

James J Lee, Carson C Chow
doi: 10.1101/003160

ABSTRACT

The heritability of a trait ($h^2$) is the proportion of its population variance caused by genetic differences, and estimates of this parameter are important for interpreting the results of genome-wide association studies (GWAS). In recent years, researchers have adopted a novel method for estimating a lower bound on heritability directly from GWAS data that uses realized genetic similarities between nominally unrelated individuals. The quantity estimated by this method is purported to be the contribution to heritability that could in principle be recovered from association studies employing the given panel of SNPs ($h^2_\textrm{SNP}$). Thus far the validity of this approach has mostly been tested empirically. Here, we provide a mathematical explication and show that the method should remain a robust means of obtaining $h^2_\textrm{SNP}$ under circumstances wider than those under which it has so far been derived.

Tuesday, December 30, 2014

Measuring missing heritability: Inferring the contribution of common variants


This recent paper from Eric Lander proposes an alternative to GCTA. There is an interesting change in tone vis a vis an earlier paper with Zuk. Instead of speculating about explanations of missing heritability (beyond the existence of yet undiscovered common variants of small effect), the paper focuses on the claim that REML/GCTA underestimates the heritability due to common variants in case-control designs. The proposed alternative methodology, called phenotype correlation–genetic correlation (PCGC) regression, estimates heritability by directly regressing phenotype correlation vs genotype correlation across all pairs in the sample. (This is how I usually explain the concept behind GCTA when I don't want to get into details of REML, LMMs, etc.)

Personally, I am not especially concerned about the precise value of heritability estimates from REML/GCTA or PCGC, as there are significant uncertainties that go beyond the simple additive model assumed in both of these methods (e.g., due to nonlinear genetic architecture). For me it is sufficient that the results of both are consistent with classical estimates from twin and adoption studies, and yield h2 ~ 0.5 or higher for many interesting traits.
Measuring missing heritability: Inferring the contribution of common variants (PNAS)

D. Golan, E. Lander and S. Gosset

Studies have identified thousands of common genetic variants associated with hundreds of diseases. Yet, these common variants typically account for a minority of the heritability, a problem known as “missing heritability.” Geneticists recently proposed indirect methods for estimating the total heritability attributable to common variants, including those whose effects are too small to allow identification in current studies. Here, we show that these methods seriously underestimate the true heritability when applied to case–control studies of disease. We describe a method that provides unbiased estimates. Applying it to six diseases, we estimate that common variants explain an average of 60% of the heritability for these diseases. The framework also may be applied to case–control studies, extreme-phenotype studies, and other settings.
From the conclusion:
... Our results suggest that larger CVASs [GWAS] will identify many additional common variants related to common diseases, although many additional common variants likely still will have effect sizes that fall below the limits of detection given practically achievable sample sizes. Still, common variants clearly will not explain all heritability. As discussed in the first two papers in this series (2,3), rare genetic variants and genetic interactions likely will make important contributions as well. Fortunately, advances in DNA sequencing technology should make it possible in the coming years to carry out comprehensive studies of both common and rare genetic variants in tens (and possibly hundreds) of thousands of cases and controls, resulting in a fuller picture of the genetic architecture of common diseases.
Hopefully, more papers like this one will help the field of genomics to update its priors: the most reasonable hypothesis concerning "missing heritability" is simply that larger sample size is required to find the many remaining alleles of small effect. Fisher's infinitesimal model will turn out to be a good first approximation for most human traits. See also Additivity and complex traits in mice.

Monday, April 22, 2013

Common variants vs mutational load

I recommend this blog post (The Differentialist) by Timothy Bates of the University of Edinburgh. (I met Tim there at last year's Behavior Genetics meeting.) He discusses the implications of GCTA results showing high heritability of IQ as measured using common SNPs (see related post Eric, why so gloomy?). One unresolved issue (see comments there) is to what extent mutational load (deleterious effects due to very rare variants) can account for population variation in IQ. The standard argument is that very rare variants will not be well tagged by common SNPs and hence the heritability results (e.g., of about 0.5) found by GCTA suggest that a good chunk of variation is accounted for by common variants (e.g., MAF > 0.05). The counter argument (which I have not yet seen investigated fully) is that relatedness defined over a set of common SNPs is correlated to the similarity in mutational load of a pair of individuals, due to the complex family history of human populations. IIRC, "unrelated" individuals selected at random from a common ethnic group and region are, on average, roughly as related as third cousins (say, r ~ 1E-02?).

Is the heritability detected using common SNPs due to specific common variants tagged by SNPs, or due to a general correlation between SNP relatedness and overall similarity of genomes?

My guess is that we'll find that both common variants and mutational load are responsible for variation in cognitive ability. Does existing data provide any limit on the relative ratio? This requires a calculation, but my intuition is that mutational load cannot account for everything. Fortunately, with whole genome data you can look both for common variants and at mutational load at the same time.

In the case of height it's now clear that common variants account for a significant fraction of heritability, but there is also evidence for a mutational load component. Note that we don't expect to discover any common variants for IQ until past a threshold in sample size, which for height turned out to be about 10k.


Hmm, now that I think about it ... there does seem to be a relevant calculation :-)

In the original GCTA paper (Yang et al. Nature Genetics 2010), it was found that relatedness computed on a set of common genotyped SNPs is a poor predictor of relatedness on rare SNPs (e.g., MAF < 0.1). The rare SNPs are in poor linkage disequilibrium (LD) with the genotyped SNPs, due to the difference in MAF. This was proposed as a plausible mechanism for the still-missing heritability (e.g., 0.4 vs 0.8 expected from classical twin/sib studies; Yang et al. specifically looked at height): if the actual causal variants tend to be rarer than the common genotyped SNPs, the genotypic similarity of two individuals where it counts -- on the causal variants -- would be incorrectly estimated, leading to an underestimate of heritability.

If these simulations are any guide, rare mutations are unlikely to account for the GCTA heritability, but rather may account for (some of) the gap between it and the total additive heritability. See, for example, the following discussion:
A commentary on “Common SNPs explain a large proportion of the heritability for human height” by Yang et al. (2010)

(p.6) ... We cannot measure the LD between causal variants and genotyped SNPs directly because we do not know the causal variants. However, we can estimate the LD between SNPs. If the causal variants have similar characteristics to the SNPs, the LD between causal variants and SNPs should be similar to that between the SNPs themselves. One causal variant can be in LD with multiple SNPs and so the SNPs collectively could trace the causal variant even though no one SNP was in perfect LD with it. Therefore we divided the SNPs randomly into two groups and treated the first group as if they were causal variants and asked how well the second group of SNPs tracked these simulated causal variants. This can be judged by the extent to which the relationship matrices calculated from the SNPs agree with the relationship matrix calculated from the ‘causal variants’. The covariance between the estimated relationships for the two sets of SNPs equals the true variance of relatedness whereas the variance of the estimates of relatedness for each set of SNPs equals true variation in relatedness plus estimation error. Therefore, from the regression of pairwise relatedness estimated from one of the set of SNPs onto the estimated pairwise relatedness from the other set of SNPs we can quantify the amount of error and ‘regress back’ or ‘shrink’ the estimate of relatedness towards the mean to take account of the prediction error.

... If causal variants have a lower MAF than common SNPs the LD between SNPs and causal variants is likely to be lower than the LD between random SNPs. To investigate the effect of this possibility we used SNPs with low MAF to mimic causal variants. We found that the relationship estimated by random SNPs (with MAF typical of the genotyped SNPs on the array) was a poorer predictor of the relationship at these ‘causal variants’ than it was of the relationship at other random SNPs. When the relationship matrix at the SNPs is shrunk to provide an unbiased estimate of the relationship at these ‘causal variants’, we find that the ‘causal variants’ would explain 80% of the phenotypic variance ...

Wednesday, August 03, 2016

Machine Learning for Personalized Medicine: Heritability-based models for prediction of complex traits (David Balding)

Highly recommended talk by David Balding on modern approaches to heritability, relatedness, etc. in statistical genetics. (I listened at 1.5x normal speed, which worked for me.)


MLPM (Machine Learning for Personalized Medicine) Summer School 2015
Monday 21st of September

Heritability-based models for prediction of complex traits
by David Balding

Complex trait genetics has been revolutionised over the past 5 years by developments related to the concept of heritability. Heritability is the fraction of phenotypic variation that can be attributed to genetic mechanisms (mostly we focus on narrow-sense heritability, which considers only additive genetic effects). Since we cannot identify and measure the causal genetic mechanisms, a traditional approach has been to use pedigree relatedness as a proxy for the sharing of causal alleles between individuals. Pedigree relatedness even came to be seen as central to the concept of heritability, which perhaps explains why it was not until 2010 that it became widely appreciated that genome-wide genetic markers (SNPs) offered at least a "noisy" way to directly measure causal alleles, and hence a new approach to assessing heritability. This approach is "noisy" because SNPs generally only tag causal variants imperfectly, depending on SNP density and linkage disequilibrium, and many SNPs may tag little or no causal variation. So genome-wide SNP-based heritability estimates are difficult to interpret, but they can provide a lower bound which was enough to show that SNPs usually tag much more causal variation than can be attributed to genome-wide significant SNPs. Another big step forward has been that heritability can be attributed to different genes, genomic regions or functional classes, and for many phenotypes it is found to be widely dispersed across the genome, with relatively little concentration in coding regions. Further, heritability has become a unit of common currency for gene-based tests and meta-analysis. I will review the ideas and the underlying mathematical models, and present some recent results.
Some comments:

1. He notes that after a few hundred years, it's highly likely that a given descendant carries no actual DNA from a specific ancestor (e.g., most descendants of Shakespeare alive today have none of his DNA).

2. @18min or so: a request to Chris Chang to add a modified definition of SNP relatedness to PLINK (i.e., new flag), with a different weighting for the heterozygous (1,1) case  ;-)

3. @29min or so: finally, a discussion of systematic errors in GCTA due to LD characteristics of causal variants. As I said here:
I've always felt that the real weakness of GCTA is the assumption of random effects. A consequence of this assumption is that if the true causal variants are atypical (e.g., in terms of linkage disequilibrium) among common SNPs, the results could be biased. It is impossible to evaluate this uncertainty at the moment because we do not yet know the (full) genetic architectures of any complex traits.
See also Heritability Estimates from Summary Statistics, No Genomic Dark Matter, and HaploSNPs and missing heritability.

4. @35min: again T1D stands out in terms of genetic architecture

5. @47min: predictive correlations of almost 0.6 for T1D

Slides for this talk. Slides for another Balding lecture: Introduction to Genomic Prediction.


Tuesday, September 19, 2017

Accurate Genomic Prediction Of Human Height

I've been posting preprints on arXiv since its beginning ~25 years ago, and I like to share research results as soon as they are written up. Science functions best through open discussion of new results! After some internal deliberation, my research group decided to post our new paper on genomic prediction of human height on bioRxiv and arXiv.

But the preprint culture is nascent in many areas of science (e.g., biology), and it seems to me that some journals are not yet fully comfortable with the idea. I was pleasantly surprised to learn, just in the last day or two, that most journals now have official policies that allow online distribution of preprints prior to publication. (This has been the case in theoretical physics since before I entered the field!) Let's hope that progress continues.

The work presented below applies ideas from compressed sensing, L1 penalized regression, etc. to genomic prediction. We exploit the phase transition behavior of the LASSO algorithm to construct a good genomic predictor for human height. The results are significant for the following reasons:
We applied novel machine learning methods ("compressed sensing") to ~500k genomes from UK Biobank, resulting in an accurate predictor for human height which uses information from thousands of SNPs.

1. The actual heights of most individuals in our replication tests are within a few cm of their predicted height.

2. The variance captured by the predictor is similar to the estimated GCTA-GREML SNP heritability. Thus, our results resolve the missing heritability problem for common SNPs.

3. Out-of-sample validation on ARIC individuals (a US cohort) shows the predictor works on that population as well. The SNPs activated in the predictor overlap with previous GWAS hits from GIANT.
The scatterplot figure below gives an immediate feel for the accuracy of the predictor.
Accurate Genomic Prediction Of Human Height
(bioRxiv)

Louis Lello, Steven G. Avery, Laurent Tellier, Ana I. Vazquez, Gustavo de los Campos, and Stephen D.H. Hsu

We construct genomic predictors for heritable and extremely complex human quantitative traits (height, heel bone density, and educational attainment) using modern methods in high dimensional statistics (i.e., machine learning). Replication tests show that these predictors capture, respectively, ∼40, 20, and 9 percent of total variance for the three traits. For example, predicted heights correlate ∼0.65 with actual height; actual heights of most individuals in validation samples are within a few cm of the prediction. The variance captured for height is comparable to the estimated SNP heritability from GCTA (GREML) analysis, and seems to be close to its asymptotic value (i.e., as sample size goes to infinity), suggesting that we have captured most of the heritability for the SNPs used. Thus, our results resolve the common SNP portion of the “missing heritability” problem – i.e., the gap between prediction R-squared and SNP heritability. The ∼20k activated SNPs in our height predictor reveal the genetic architecture of human height, at least for common SNPs. Our primary dataset is the UK Biobank cohort, comprised of almost 500k individual genotypes with multiple phenotypes. We also use other datasets and SNPs found in earlier GWAS for out-of-sample validation of our results.
This figure compares predicted and actual height on a validation set of 2000 individuals not used in training: males + females, actual heights (vertical axis) uncorrected for gender. For training we z-score by gender and age (due to Flynn Effect for height). We have also tested validity on a population of US individuals (i.e., out of sample; not from UKBB).


This figure illustrates the phase transition behavior at fixed sample size n and varying penalization lambda.


These are the SNPs activated in the predictor -- about 20k in total, uniformly distributed across all chromosomes; vertical axis is effect size of minor allele:


The big picture implication is that heritable complex traits controlled by thousands of genetic loci can, with enough data and analysis, be predicted from DNA. I expect that with good genotype | phenotype data from a million individuals we could achieve similar success with cognitive ability. We've also analyzed the sample size requirements for disease risk prediction, and they are similar (i.e., ~100 times sparsity of the effects vector; so ~100k cases + controls for a condition affected by ~1000 loci).


Note Added: Further comments in response to various questions about the paper.

1) We have tested the predictor on other ethnic groups and there is an (expected) decrease in correlation that is roughly proportional to the "genetic distance" between the test population and the white/British training population. This is likely due to different LD structure (SNP correlations) in different populations. A SNP which tags the true causal genetic variation in the Euro population may not be a good tag in, e.g., the Chinese population. We may report more on this in the future. Note, despite the reduction in power our predictor still captures more height variance than any other existing model for S. Asians, Chinese, Africans, etc.

2) We did not explore the biology of the activated SNPs because that is not our expertise. GWAS hits found by SSGAC, GIANT, etc. have already been connected to biological processes such as neuronal growth, bone development, etc. Plenty of follow up work remains to be done on the SNPs we discovered.

3) Our initial reduction of candidate SNPs to the top 50k or 100k is simply to save computational resources. The L1 algorithms can handle much larger values of p, but keeping all of those SNPs in the calculation is extremely expensive in CPU time, memory, etc. We tested computational cost vs benefit in improved prediction from including more (>100k) candidate SNPs in the initial cut but found it unfavorable. (Note, we also had a reasonable prior that ~10k SNPs would capture most of the predictive power.)

4) We will have more to say about nonlinear effects, additional out-of-sample tests, other phenotypes, etc. in future work.

5) Perhaps most importantly, we have a useful theoretical framework (compressed sensing) within which to think about complex trait prediction. We can make quantitative estimates for the sample size required to "solve" a particular trait.

I leave you with some remarks from Francis Crick:
Crick had to adjust from the "elegance and deep simplicity" of physics to the "elaborate chemical mechanisms that natural selection had evolved over billions of years." He described this transition as, "almost as if one had to be born again." According to Crick, the experience of learning physics had taught him something important — hubris — and the conviction that since physics was already a success, great advances should also be possible in other sciences such as biology. Crick felt that this attitude encouraged him to be more daring than typical biologists who tended to concern themselves with the daunting problems of biology and not the past successes of physics.

Wednesday, January 13, 2016

Heritability Estimates from Summary Statistics

This paper describes a method for estimating heritability of a complex trait due to a single locus (DNA region), which the authors refer to as local heritability. It does not make the GCTA assumption of random effects. Instead, it uses GWAS estimates of individual effect sizes and the population LD matrix (covariance matrix of loci). Common SNPs in aggregate are found to account for significant heritability for various complex traits, including height, edu years (proxy for cognitive ability), schizophrenia risk (SCZ), etc. (See table below.)

Note, I could not find a link to the Supplement, which apparently contains some interesting results.

See also GCTA missing heritability and all that.
Contrasting the genetic architecture of 30 complex traits from summary association data
http://dx.doi.org/10.1101/035907

Variance components methods that estimate the aggregate contribution of large sets of variants to the heritability of complex traits have yielded important insights into the disease architecture of common diseases. Here, we introduce new methods that estimate the total variance in trait explained by a single locus in the genome (local heritability) from summary GWAS data while accounting for linkage disequilibrium (LD) among variants. We apply our new estimator to ultra large-scale GWAS summary data of 30 common traits and diseases to gain insights into their local genetic architecture. First, we find that common SNPs have a high contribution to the heritability of all studied traits. Second, we identify traits for which the majority of the SNP heritability can be confined to a small percentage of the genome. Third, we identify GWAS risk loci where the entire locus explains significantly more variance in the trait than the GWAS reported variants. Finally, we identify 55 loci that explain a large proportion of heritability across multiple traits.


Tuesday, August 11, 2015

Explain it to me like I'm five years old

An MIT Technology Review reporter interviewed me yesterday about my Nautilus Magazine article Super-Intelligent Humans Are Coming. I had to do the interview by gchat because my voice is recovering from a terrible cold and too much yakking with brain scientists at the Allen Institute in Seattle.

I realized I need to find an explanation for the thesis of the article which is as simple as possible -- so that MIT graduates can understand it ;-)

Let me know what you think of the following.
1. Cognitive ability is highly heritable. At least half the variance is genetic in origin.

2. It is influenced by many (probably thousands) of common variants (see GCTA estimates of heritability due to common SNPs). We know there are many because the fewer there are the larger the (average) individual effect size of each variant would have to be. But then the SNPs would be easy to detect with small sample size.

Recent studies with large sample sizes detected ~70 SNP hits, but would have detected many more if effect sizes were consistent with, e.g., only hundreds of causal variants in total.

3. Since these are common variants the probability of having the negative variant -- with (-) effect on g score -- is not small (e.g., like 10% or more).

4. So each individual is carrying around many hundreds (if not thousands) of (-) variants.

5. As long as effects are roughly additive, we know that changing ALL or MOST of these (-) variants into (+) variants would push an individual many standard deviations (SDs) above the population mean. Such an individual would be far beyond any historical figure in cognitive ability. 
Given more details we can estimate the average number of (-) variants carried by individuals, and how many SDs are up for grabs from flipping (-) to (+). As is the case with most domesticated plants and animals, we expect that the existing variation in the population allows for many SDs of improvement (see figure below).
For references and more detailed explanation, see On the Genetic Architecture of Cognitive Ability and Other Heritable Traits.

Saturday, June 22, 2013

WDIST and PLINK

News from BGI Cognitive Genomics.
31 May 2013: We have started the process of returning genetic data to our first round of volunteers. Everyone who was sequenced will be contacted within the next few weeks.

We are also starting public testing of our new bioinformatics tool: WDIST, an increasingly complete rewrite of PLINK designed for tomorrow's large datasets, developed by Christopher Chang with support from the NIH-NIDDK's Laboratory of Biological Modeling and others. It uses a streaming strategy to reduce memory requirements, and executes many of PLINK's slowest functions, including identity-by-state/identity-by-descent computation, LD-based pruning of marker sets, and association analysis max(T) permutation tests, over 100x (and sometimes even over 1000x) as quickly. Some newer calculations, such as the GCTA relationship matrix, are also supported. We have developed several novel algorithms, including a fast Fisher's exact test (2x2/2x3) which comfortably handles contingency tables with entries in the millions (try our browser demo!). Software engineers can see more details on our WDIST core algorithms page, and download the GPLv3 source code from our GitHub repository.

Monday, December 02, 2013

PLINK 1.90 alpha


WDIST is now PLINK 1.9 alpha. WDIST (= "weighted distance" calculator) was originally written to compute pairwise genomic distances. The mighty Chris Chang then amazingly re-implemented all of PLINK with significant improvements (see below).

PLINK 1.9 even has support for LASSO (i.e., L1 penalized optimization, a particular method for Compressed Sensing).
This is a comprehensive update to Shaun Purcell's popular PLINK command-line program, developed by Christopher Chang with support from the NIH-NIDDK's Laboratory of Biological Modeling and others. (What's new?) (Credits.)

It isn't finished yet (hence the 'alpha' designation), but it's getting there. We are working with Dr. Purcell to launch a large-scale beta test in the near future. ...

Unprecedented speed 
Thanks to heavy use of bitwise operators, sequential memory access patterns, multithreading, and higher-level algorithmic improvements, PLINK 1.9 is much, much faster than PLINK 1.07 and other popular software. Several of the most demanding jobs, including identity-by-state matrix computation, distance-based clustering, LD-based pruning, and association analysis max(T) permutation tests, now complete hundreds or even thousands of times as quickly, and even the most trivial operations tend to be 5-10x faster due to I/O improvements.

We hasten to add that the vast majority of ideas contributing to PLINK 1.9's performance were developed elsewhere; in several cases, we have simply ported little-known but outstanding implementations without significant further revision (even while possibly uglifying them beyond recognition; sorry about that, Roman...). See the credits page for a partial list of people to thank. On a related note, if you are aware of an implementation of a PLINK command which is substantially better what we currently do, let us know; we'll be happy to switch to their algorithm and give them credit in our documentation and papers.

Nearly unlimited scale 
The main genomic data matrix no longer has to fit in RAM, so bleeding-edge datasets containing tens of thousands of individuals with exome- or whole-genome sequence calls at millions of sites can be processed on ordinary desktops (and this processing will usually complete in a reasonable amount of time). In addition, several key individual x individual and variant x variant matrix computations (including the GRM mentioned below) can be cleanly split across computing clusters (or serially handled in manageable chunks by a single computer).

Command-line interface improvements
We've standardized how the command-line parser works, migrated from the original 'everything is a flag' design toward a more organized flags + modifiers approach (while retaining backwards compatibility), and added a thorough command-line help facility.

Additional functions
In 2009, GCTA didn't exist. Today, there is an important and growing ecosystem of tools supporting the use of genetic relationship matrices in mixed model association analysis and other calculations; our contributions are a fast, multithreaded, memory-efficient --make-grm-gz/--make-grm-bin implementation which runs on OS X and Windows as well as Linux, and a closer-to-optimal --rel-cutoff pruner.

There are other additions here and there, such as cluster-based filters which might make a few population geneticists' lives easier, and a coordinate-descent LASSO. New functions are not a top priority for now (reaching 95%+ backward compatibility, and supporting dosage/phased/triallelic data, are more important...), but we're willing to take time off from just working on the program core if you ask nicely.

Thursday, April 07, 2016

GWAS of cognitive function using UK Biobank data

This paper is based on analysis of UK Biobank data. The phenotypes (cognitive scores) were obtained via brief on-screen tests. Although there is significant noise in the scores obtained (see test-retest correlations in the table at bottom), there was enough signal to obtain a number of genome-wide significant SNP hits.
Genome-wide association study of cognitive functions and educational attainment in UK Biobank (N=112,151)

Nature Molecular Psychiatry 5 April 2016 doi: 10.1038/mp.2016.45

People’s differences in cognitive functions are partly heritable and are associated with important life outcomes. Previous genome-wide association (GWA) studies of cognitive functions have found evidence for polygenic effects yet, to date, there are few replicated genetic associations. Here we use data from the UK Biobank sample to investigate the genetic contributions to variation in tests of three cognitive functions and in educational attainment. GWA analyses were performed for verbal–numerical reasoning (N=36 035), memory (N=112 067), reaction time (N=111 483) and for the attainment of a college or a university degree (N=111 114). We report genome-wide significant single-nucleotide polymorphism (SNP)-based associations in 20 genomic regions, and significant gene-based findings in 46 regions. These include findings in the ATXN2, CYP2DG, APBA1 and CADM2 genes. We report replication of these hits in published GWA studies of cognitive function, educational attainment and childhood intelligence. There is also replication, in UK Biobank, of SNP hits reported previously in GWA studies of educational attainment and cognitive function. GCTA-GREML analyses, using common SNPs (minor allele frequency>0.01), indicated significant SNP-based heritabilities of 31% (s.e.m.=1.8%) for verbal–numerical reasoning, 5% (s.e.m.=0.6%) for memory, 11% (s.e.m.=0.6%) for reaction time and 21% (s.e.m.=0.6%) for educational attainment. Polygenic score analyses indicate that up to 5% of the variance in cognitive test scores can be predicted in an independent cohort. The genomic regions identified include several novel loci, some of which have been associated with intracranial volume, neurodegeneration, Alzheimer’s disease and schizophrenia.


Discussion

The results of the present study make novel contributions to three scientific aims of GWAS: helping towards identifying specific mechanisms of genomic variation; describing the genetic architecture of complex traits; and predicting phenotypic variation in independent samples. The most important novel contribution of the present study is the discovery of many new genome-wide significant genetic variants associated with reasoning ability, cognitive processing speed and the attainment of a college or university degree. The study provided robust estimates of the SNP-based heritability of the four cognitive variables and their genetic correlations. The study makes important steps toward genetic consilience, because several of the genomic regions identified by the present analyses have previously been associated in GWASs of general cognitive function, executive function, educational attainment, intracranial volume, neurodegenerative disorders and Alzheimer’s disease. The study was successful in using the GWAS results from UK Biobank to predict cognitive variation in new samples. ...

Tuesday, April 05, 2016

This is for PZ Myers

[ See here for added detailed discussion of this topic. ]

Scott Alexander (Slate Star Codex), Garett Jones (Hive Mind), and Razib Khan (GNXP) alerted me (via Twitter) of this post by PZ Myers.

Myers is both confused and insulting in his blog post, but I'll refrain from ad hominem attacks, and just focus on the science.

Myers seems to think that humans with much better cognitive abilities than our own can't exist. Sort of like a farmer in 1957 claiming that chickens that are bigger and faster maturing than his own could not exist (see figure below). I urge Myers to read some books on quantitative / population genetics before returning to this discussion.

The argument for why there are probably genomes not very different from our own, but which lead to much better cognitive ability, is very simple, and I went through it in a post called Explain it to me like I'm five years old, excerpted below:
1. Cognitive ability is highly heritable. At least half the variance is genetic in origin.

2. It is influenced by many (probably thousands) of common variants (see GCTA estimates of heritability due to common SNPs). We know there are many because the fewer there are the larger the (average) individual effect size of each variant would have to be. But then the SNPs would be easy to detect with small sample size.

Recent studies with large sample sizes detected ~70 SNP hits, but would have detected many more if effect sizes were consistent with, e.g., only hundreds of causal variants in total.

[ Myers seems to be confused about the difference between specific (protein coding) genes, of which there may be only ~20k in the human genome, and the set of all variations in the DNA code, of which there are many, many more. Thousands of variants (or 10k) out of this much larger number is a tiny fraction much less than one. ]

3. Since these are common variants the probability of having the negative variant, with (-) effect on g score, is not small (e.g., like 10% or more).

4. So each individual is carrying around many hundreds (if not thousands) of (-) variants.

5. As long as effects are roughly additive, we know that changing ALL or MOST of these (-) variants into (+) variants would push an individual many standard deviations (SDs) above the population mean. Such an individual would be far beyond any historical figure in cognitive ability. [ This is exactly what has been accomplished via selection in the chickens below. ]
Given more details we can estimate the average number of (-) variants carried by individuals, and how many SDs are up for grabs from flipping (-) to (+). As is the case with most domesticated plants and animals, we expect that the existing variation in the population allows for many SDs of improvement (see figure below).
For references and more detailed explanation, see On the Genetic Architecture of Cognitive Ability and Other Complex Traits.

Attention PZ: The basic quantitative / population genetics used above is recapitulated by famous geneticist James Crow (Wisconsin-Madison) here and here. You can take his word over mine, since I'm only a physicist. But note that Crow cites Feynman PhD student (i.e., theoretical physicist) Thomas Nagylaki (later a famous geneticist at Chicago) for proving a tour de force result in evolutionary genetics of additive traits. Do your HW next time.

Note Added: See this August 2016 post for more discussion, in response to some comments by Greg Cochran.

References: There are some requests for references in the discussion thread below. The place to start is On the Genetic Architecture of Cognitive Ability and Other Complex Traits, but see below.

In this paper Crow discusses the prevalence of additive genetic effects, and the consequent (in the case of highly polygenic traits) large pool of variance upon which selection can act. I have merely pointed out that cognitive ability is an example of the kind of complex polygenic trait that Crow described.

Nagylaki's paper The Evolution of Multilocus Systems under Weak Selection extends Fisher's Fundamental Theorem of Natural Selection (fundamental to our theoretical understanding of evolution, but unknown to most biologists; note the role of additive variance). Evidence for additive genetic architecture in, e.g., mice, yeast, cows, etc. Additive models are used extensively in agricultural breeding.

Nagylaki's textbook on population genetics is free.

Physicists can master these results quickly via Statistical Genetics and Evolution of Quantitative Traits (Neher and Shraiman).

Tuesday, September 07, 2021

Kathryn Paige Harden Profile in The New Yorker (Behavior Genetics)

This is a good profile of behavior geneticist Paige Harden (UT Austin professor of psychology, former student of Eric Turkheimer), with a balanced discussion of polygenic prediction of cognitive traits and the culture war context in which it (unfortunately) exists.
Can Progressives Be Convinced That Genetics Matters? 
The behavior geneticist Kathryn Paige Harden is waging a two-front campaign: on her left are those who assume that genes are irrelevant, on her right those who insist that they’re everything. 
Gideon Lewis-Kraus
Gideon Lewis-Kraus is a talented writer who also wrote a very nice article on the NYTimes / Slate Star Codex hysteria last summer.

Some references related to the New Yorker profile:
1. The paper Harden was attacked for sharing while a visiting scholar at the Russell Sage Foundation: Game Over: Genomic Prediction of Social Mobility 

2. Harden's paper on polygenic scores and mathematics progression in high school: Genomic prediction of student flow through high school math curriculum 

3. Vox article; Turkheimer and Harden drawn into debate including Charles Murray and Sam Harris: Scientific Consensus on Cognitive Ability?

A recent talk by Harden, based on her forthcoming book The Genetic Lottery: Why DNA Matters for Social Equality


Regarding polygenic prediction of complex traits 

I first met Eric Turkheimer in person (we had corresponded online prior to that) at the Behavior Genetics Association annual meeting in 2012, which was back to back with the International Conference on Quantitative Genetics, both held in Edinburgh that year (photos and slides [1] [2] [3]). I was completely new to the field but they allowed me to give a keynote presentation (if memory serves, together with Peter Visscher). Harden may have been at the meeting but I don't recall whether we met. 

At the time, people were still doing underpowered candidate gene studies (there were many talks on this at BGA although fewer at ICQG) and struggling to understand GCTA (Visscher group's work showing one can estimate heritability from modestly large GWAS datasets, results consistent with earlier twins and adoption work). Consequently a theoretical physicist talking about genomic prediction using AI/ML and a million genomes seemed like an alien time traveler from the future. Indeed, I was.

My talk is largely summarized here:
On the genetic architecture of intelligence and other quantitative traits 
https://arxiv.org/abs/1408.3421 
How do genes affect cognitive ability or other human quantitative traits such as height or disease risk? Progress on this challenging question is likely to be significant in the near future. I begin with a brief review of psychometric measurements of intelligence, introducing the idea of a "general factor" or g score. The main results concern the stability, validity (predictive power), and heritability of adult g. The largest component of genetic variance for both height and intelligence is additive (linear), leading to important simplifications in predictive modeling and statistical estimation. Due mainly to the rapidly decreasing cost of genotyping, it is possible that within the coming decade researchers will identify loci which account for a significant fraction of total g variation. In the case of height analogous efforts are well under way. I describe some unpublished results concerning the genetic architecture of height and cognitive ability, which suggest that roughly 10k moderately rare causal variants of mostly negative effect are responsible for normal population variation. Using results from Compressed Sensing (L1-penalized regression), I estimate the statistical power required to characterize both linear and nonlinear models for quantitative traits. The main unknown parameter s (sparsity) is the number of loci which account for the bulk of the genetic variation. The required sample size is of order 100s, or roughly a million in the case of cognitive ability.
The predictions in my 2012 BGA talk and in the 2014 review article above have mostly been validated. Research advances often pass through the following phases of reaction from the scientific community:
1. It's wrong ("genes don't affect intelligence! anyway too complex to figure out... we hope")
2. It's trivial ("ofc with lots of data you can do anything... knew it all along")
3. I did it first ("please cite my important paper on this")
Or, as sometimes attributed to Gandhi: "First they ignore you, then they laugh at you, then they fight you, then you win.”


Technical note

In 2014 I estimated that ~1 million genotype | phenotype pairs would be enough to capture most of the common SNP heritability for height and cognitive ability. This was accomplished for height in 2017. However, the sample size of well-phenotyped individuals is much smaller for cognitive ability, even in 2021, than for height in 2017. For example, in UK Biobank the cognitive test is very brief (~5 minutes IIRC, a dozen or so questions), but it has not even been administered to the full cohort as yet. In the Educational Attainment studies the phenotype EA is only moderately correlated (~0.3 ?) or so with actual cognitive ability.

Hence, although the most recent EA4 results use 3 million individuals [1], and produce a predictor which correlates ~0.4 with actual EA, the statistical power available is still less than what I predicted would be required to train a really good cognitive ability predictor.

In our 2017 height paper, which also briefly discussed bone density and cognitive ability prediction, we built a cognitve ability predictor roughly as powerful as EA3 using only ~100k individuals with the noisy UKB test data. So I remain confident that  ~million individuals with good cognitive scores (e.g., SAT, AFQT, full IQ test) would deliver results far beyond what we currently have available. We also found that our predictor, built using actual (albeit noisy) cognitive scores exhibits less power reduction in within-family (sibling) analyses compared to EA. So there is evidence that (no surprise) EA is more influenced by environmental factors, including so-called genetic nurture effects, than is cognitive ability.

A predictor which captures most of the common SNP heritability for cognitive ability might correlate ~0.5 or 0.6 with actual ability. Applications of this predictor in, e.g., studies of social mobility or educational success or even longevity using existing datasets would be extremely dramatic.

Saturday, January 06, 2018

Institute for Advanced Study: Genomic Prediction of Complex Traits (seminar)


Genomic Prediction of Complex Traits

After a brief review (suitable for physicists) of computational genomics and complex traits, I describe recent progress in this area. Using methods from Compressed Sensing (L1-penalized regression; Donoho-Tanner phase transition with noise) and the UK BioBank dataset of 500k SNP genotypes, we construct genomic predictors for several complex traits. Our height predictor captures nearly all of the predicted SNP heritability for this trait -- thereby resolving the missing heritability problem. Actual heights of most individuals in validation tests are within a few cm of predicted heights. I also discuss application of these methods to cognitive ability and polygenic disease risk: sparsity estimates (of the number of causal loci), combined with phase transition scaling analysis, allow estimates of the amount of data required to construct good predictors. Finally, I discuss how these advances will affect human health and reproduction (embryo selection for In Vitro Fertilization, genetic editing) in the coming decade.

FEATURING
Steve Hsu

SPEAKER AFFILIATION
Michigan State University

I recently gave a similar talk at 23andMe (slides at link).

Note Added: Many people asked for video of this talk, but alas recording talks is not standard practice at IAS. I did give a similar talk using the same slides just a week later at the Allen Institute in Seattle (Symposium on Genetics of Complex Traits): video here.


Some Comments and Slides:

I tried to make the talk understandable to physicists, and at least according to what I was told (and my impression from the questions asked during and after the talk), largely succeeded. Early on, when presenting the phenotype function y(g), both Nima Arkani-Hamed (my host) and Ed Witten asked some questions about the "units" of the various quantities involved. In the actual computation everything is z-scored: measured in units of SD relative to the sample mean. I didn't realize until later that there was some confusion about how this is done for the "state variable" of the genetic locus g_i. In fact, when the gene array is read the result is 0,1,2 for homozygous common allele, heterozygous, homozygous rare allele, respectively. (I might have that backwards but you get the point.) For each locus there is a minor allele frequency (MAF) and this determines the sample average and SD of the distribution of 0's, 1's, and 2's. It is the z-scored version of this variable that appears in the computation. I didn't realize certain people were following the details so closely in the talk but I should not be surprised ;-) In the future I'll include a slide specifically on this to avoid confusion.

Looking at my slide on missing heritability, Witten immediately noted that estimating SNP heritability (as opposed to total or broad sense heritability) is nontrivial and I had to quickly explain the GCTA technique!

During the talk I discussed the theoretical reason we expect to find a lot of additive variance: nonlinear gadgets are fragile (easy to break through recombination in sexual reproduction), whereas additive genetic variance can be reliably passed on and is easy for natural selection to act on***. (See also Fisher's Fundamental Theorem of Natural Selection. More.) Usually these comments pass over the head of the audience but at IAS I am sure quite a few people understood the point.

One non-physicist reader of this blog braved IAS security and managed to attend the lecture. I am flattered, and I invite him to share his impressions in the comments!

Afterwards there was quite a bit of additional discussion which spilled over into tea time. The important ideas: how Compressed Sensing works, the nature of the phase transition, how we can predict the amount of data required to build a good predictor (capturing most of the SNP heritability) using the universality of the phase transition + estimate of sparsity, etc. were clearly absorbed by the people I talked to.

Slides


*** On the genetic architecture of intelligence and other quantitative traits (p.16):
... The preceding discussion is not intended to convey an overly simplistic view of genetics or systems biology. Complex nonlinear genetic systems certainly exist and are realized in every organism. However, quantitative differences between individuals within a species may be largely due to independent linear effects of specific genetic variants. As noted, linear effects are the most readily evolvable in response to selection, whereas nonlinear gadgets are more likely to be fragile to small changes. (Evolutionary adaptations requiring significant changes to nonlinear gadgets are improbable and therefore require exponentially more time than simple adjustment of frequencies of alleles of linear effect.) One might say that, to first approximation, Biology = linear combinations of nonlinear gadgets, and most of the variation between individuals is in the (linear) way gadgets are combined, rather than in the realization of different gadgets in different individuals.

Linear models work well in practice, allowing, for example, SNP-based prediction of quantitative traits (milk yield, fat and protein content, productive life, etc.) in dairy cattle. ...

Sunday, June 09, 2019

L1 vs Deep Learning in Genomic Prediction

The paper below by some of my MSU colleagues examines the performance of a number of ML algorithms, both linear and nonlinear, including deep neural nets, in genomic prediction across several different species.

When I give talks about prediction of disease risks and complex traits in humans, I am often asked why we are not using fancy (trendy?) methods such as Deep Learning (DL). Instead, we focus on L1 penalization methods ("sparse learning") because 1. the theoretical framework (including theorems providing performance guarantees) is well-developed, and (relatedly) 2. the L1 methods perform as well or better than other methods in our own testing.

The term theoretical framework may seem unusual in ML, which is at the moment largely an empirical subject. Experience in theoretical physics shows that when powerful mathematical results are available, they can be very useful to guide investigation. In the case of sparse learning we can make specific estimates for how much data is required to "solve" a trait -- i.e., capture most of the estimated heritability in the predictor. Five years ago we predicted a threshold of a few hundred thousand genomes for height, and this turned out to be correct. Currently, this kind of performance characterization is not possible for DL or other methods.

What is especially powerful about deep neural nets is that they yield a quasi-convex (or at least reasonably efficient) optimization procedure which can learn high dimensional functions. The class of models is both tractable from a learning/optimization perspective, but also highly expressive. As I wrote here in my ICML notes (see also Elad's work which relates DL to Sparse Learning):
It may turn out that the problems on which DL works well are precisely those in which the training data (and underlying generative processes) have a hierarchical structure which is sparse, level by level. Layered networks perform a kind of coarse graining (renormalization group flow): first layers filter by feature, subsequent layers by combinations of features, etc. But the whole thing can be understood as products of sparse filters, and the performance under training is described by sparse performance guarantees (ReLU = thresholded penalization?).
However, currently in genomic prediction one typically finds that nonlinear interactions are small, which means features more complicated than single SNPs are unnecessary. (In a recent post I discussed a new T1D predictor that makes use of nonlinear haplotype interaction effects, but even there the effects are not large.) Eventually I expect this situation to change -- when we have enough whole genomes to work with, a DL approach which can (automatically) identify important features (motifs?) may allow us to go beyond SNPs and simple linear models.

Note, though, that from an information theoretic perspective (see, e.g., any performance theorems in compressed sensing) it is obvious that we will need much more data than we currently have to advance this program. Also, note that Visscher et al.'s recent GCTA work suggests that additive SNP models using rare variants (i.e., extracted from whole genome data), can account for nearly all the expected heritability for height. This implies that the power of nonlinear methods like DL may not yield qualitatively better results than simpler L1 approaches, even in the limit of very large whole genome datasets.
Benchmarking algorithms for genomic prediction of complex traits

Christina B. Azodi, Andrew McCarren, Mark Roantree, Gustavo de los Campos, Shin-Han Shiu

The usefulness of Genomic Prediction (GP) in crop and livestock breeding programs has led to efforts to develop new and improved GP approaches including non-linear algorithm, such as artificial neural networks (ANN) (i.e. deep learning) and gradient tree boosting. However, the performance of these algorithms has not been compared in a systematic manner using a wide range of GP datasets and models. Using data of 18 traits across six plant species with different marker densities and training population sizes, we compared the performance of six linear and five non-linear algorithms, including ANNs. First, we found that hyperparameter selection was critical for all non-linear algorithms and that feature selection prior to model training was necessary for ANNs when the markers greatly outnumbered the number of training lines. Across all species and trait combinations, no one algorithm performed best, however predictions based on a combination of results from multiple GP algorithms (i.e. ensemble predictions) performed consistently well. While linear and non-linear algorithms performed best for a similar number of traits, the performance of non-linear algorithms vary more between traits than that of linear algorithms. Although ANNs did not perform best for any trait, we identified strategies (i.e. feature selection, seeded starting weights) that boosted their performance near the level of other algorithms. These results, together with the fact that even small improvements in GP performance could accumulate into large genetic gains over the course of a breeding program, highlights the importance of algorithm selection for the prediction of trait values.


Blog Archive

Labels