Tuesday, August 28, 2018

Scientists of Stature


The link below is to the published version of the paper we posted on biorxiv in late 2017 (see blog discussion). Our results have since been replicated by several groups in academia and in Silicon Valley.

Biorxiv article metrics: abstract views 31k, paper downloads 6k. Not bad! Perhaps that means the community understands now that genomic prediction of complex traits is a reality, given enough data.

Had we taken a poll on the eve of releasing our biorxiv article, I suspect 90+ percent of genomics researchers would have said that ~few cm accuracy in predicted human height from genotype alone was impossible.

Since our article appeared, interesting results for complex phenotypes such as educational attainment, heart disease, diabetes, and other disease risks have been obtained.
Accurate Genomic Prediction Of Human Height

Louis Lello, Steven G. Avery, Laurent Tellier, Ana I. Vazquez, Gustavo de los Campos and Stephen D. H. Hsu

GENETICS Early online August 27, 2018; https://doi.org/10.1534/genetics.118.301267

We construct genomic predictors for heritable but extremely complex human quantitative traits (height, heel bone density, and educational attainment) using modern methods in high dimensional statistics (i.e., machine learning). The constructed predictors explain, respectively, ∼40, 20, and 9 percent of total variance for the three traits, in data not used for training. For example, predicted heights correlate ∼0.65 with actual height; actual heights of most individuals in validation samples are within a few cm of the prediction. The proportion of variance explained for height is comparable to the estimated common SNP heritability from Genome-Wide Complex Trait Analysis (GCTA), and seems to be close to its asymptotic value (i.e., as sample size goes to infinity), suggesting that we have captured most of the heritability for SNPs. Thus, our results close the gap between prediction R-squared and common SNP heritability. The ∼20k activated SNPs in our height predictor reveal the genetic architecture of human height, at least for common variants. Our primary dataset is the UK Biobank cohort, comprised of almost 500k individual genotypes with multiple phenotypes. We also use other datasets and SNPs found in earlier Genome-Wide Association Studies (GWAS) for out-of-sample validation of our results.
The published version of the paper contains several new analyses in response to reviewer comments.

We added detailed comparisons between the top SNPs activated in our predictor and earlier GIANT GWAS hits. We analyze the correlation structure of L1-activated SNPs -- the algorithm (as expected) automatically selects variants which are mostly decorrelated (statistically independent) from each other.

We compare our L1 method to simpler algorithms, such as windowing: choose a genomic window size (e.g., 200k bp) and use only the SNP in each window which accounts for the most variance. This does not work as well as L1 optimization, but can produce a respectable predictor.

We investigate the correlation structure of height-associated SNPs: to what extent can the best linear combination of GIANT GWAS-significant SNPs predict the state of one of the predictor SNPs? This raises the interesting question: how much total information (entropy) is in the human genome?

Friday, August 24, 2018

Death from the Sky: Drone Assassination


This is a ~$1000 drone, max velocity ~70kph (~45mph), range ~30min flying time, controller range ~5km. It's only 1 kilo -- so payload is limited. It is optimized for photography, not for speed or range or payload. But it gives you an idea of what is possible at the same cost as, say, a couple of cheap AR15s... A real hobbyist could construct something cheaper, faster, with bigger payload. But this you can buy with one click ready to go.

It's never been easier for a bad guy to deliver an explosive charge (e.g., fraction of a kilo) to a target from a mile away. Operating a drone like this takes almost no training.

Defeating two of them coming from different directions, staggered by a few seconds, would be extremely hard even for an active security detail. Follow the target in their car and detonate the drone near the gas tank when the car stops at an intersection. Or have the drone waiting near the intersection if you know the route in advance.

If your target is commercial aviation, hit a 747 near its fuel tank as it waits to take off. A sitting duck, and no fooling around with military gear like MANPADs -- remember, you can be a mile or more away from the airport, sitting on your hotel room balcony, or in your car ready to hit the freeway.

Will this ever happen? Thank goodness terrorists tend to be incompetent... But 9/11 was a good example of what can happen when they are not.

See also Assassination by Drone.


Tuesday, August 21, 2018

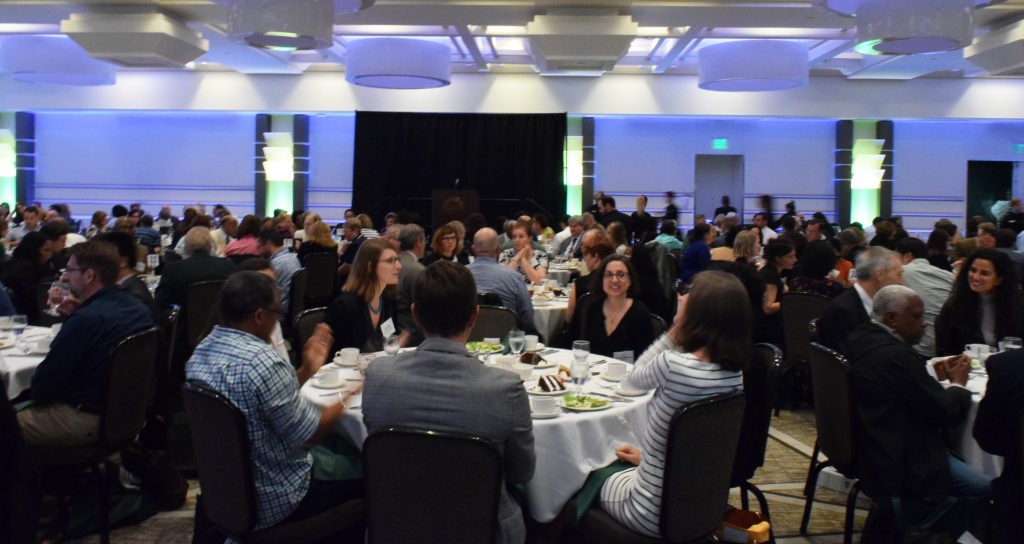
MSU New Faculty Welcome 2018


This is my welcome message to new MSU faculty and staff, presented at the 2018 New Faculty and Staff Orientation lunch.
Good afternoon and Welcome!

We are so pleased that you are here at Michigan State University. You have joined a leading research university, at a very exciting time.

I usually don’t give lengthy remarks, but since I’m not standing between you and lunch, and because so many exciting things are happening on campus, I could not resist giving something of an overview today.

With increased funding, new infrastructure, and an aggressive hiring initiative, we are positioning MSU research, and the university, for continued success. This success is built on a rich research history spanning many decades and disciplines.

In an MSU lab in 1965, Barnett Rosenberg and his team discovered that cisplatin prevents the DNA in cancer cells from replicating. Cisplatin is now a widely used chemotherapy medication. His “ah-ha” moment led to further research, but not without difficulties. The team initially failed to replicate their first results. But they worked extremely hard to resolve the issue, and subsequently had the drug through trials and approved in record time. It’s this kind of Spartan tenacity and effectiveness that we should all emulate.

Two weeks ago we celebrated the 40 year anniversary of the FDA approval of cisplatin, a therapy that is still considered the gold standard to which most new cancer treatments are compared. This discovery not only continues to help those afflicted with cancer, but the resulting royalties also fuel new research and discovery in the form of internal grants and other investments from the MSU Foundation.

My sincere hope is that one of you someday discovers the next cisplatin, or makes scholarly advances of equal importance.

Our team at the MSU Innovation Center is ready to assist faculty and student entrepreneurs with the next “big idea”. They steward more than 150 discoveries annually into a pipeline of patents, products and startup businesses. In 2017, this productivity resulted in 75 license and option agreements with companies around the world, as well as $2.4M in royalties being distributed to our faculty and departments. Applied research helps to build a diversified economy and brings jobs to Michigan and beyond. It is an increasingly important part of university activity.

I’d like to give you a bit of context for the size and scope of the research enterprise here at MSU.

MSU research continues on an upward growth trajectory. For 2017, total research expenditures were about $700M. This is a number reported each year to NSF for their Higher Education Research and Development (HERD) report. Only 5 years ago our number was closer to $500M, so this represents significant growth.

Based on the HERD comparison data, MSU ranks 1st in the Big Ten and 2nd in the nation in combined Department of Energy and National Science Foundation research expenditures.

We expect to continue our leadership in DOE and NSF funding, in part due to the Facility for Rare Isotope Beams, but also due to our work with the Plant Research Laboratory, the Great Lakes Bioenergy Research Lab and other interdisciplinary and multi-institutional research projects.

Our strategic plan outlines a number of new initiatives that leverage our current strengths and/or build new capacity to expand our portfolio, increase our competitiveness, and ultimately solve many of tomorrow’s pressing problems.

As I mentioned, MSU is home to the Facility for Rare Isotope Beams. FRIB will be a scientific user facility for the Office of Nuclear Physics in the Office of Science of the U.S. Department of Energy.

FRIB will be operational in 2021 and will deliver the highest intensity beams of rare isotopes available anywhere in the world. Estimates of the total investment in this project are roughly $1 billion dollars--a huge milestone for MSU. Operated by MSU, FRIB will enable scientists to make discoveries about the properties of rare isotopes (which are unusual forms of the elements) in order to better understand the physics of nuclei, nuclear astrophysics, and the fundamental interactions of nature. It will also produce practical applications for society, including in medicine, homeland security, and industry.

Last weekend, FRIB held a public open house attracting some 3000 people. If you didn’t have a chance to visit, you will get a glimpse this Thursday at the new faculty research orientation. I hope to see many of you there.

But new infrastructure doesn’t stop with FRIB, and I’m sure you’ve noticed all the construction on campus.

Two years ago, we opened the new BioEngineering building, which houses the Institute for Quantitative Health Science and Engineering, colloquially referred to as “IQ”. This collaboration of the colleges of Engineering, Human Medicine and Natural Science will apply quantitative methods to biomedicine and life science in an interdisciplinary setting. IQ’s researchers will develop new medical tools and treatments that will advance biomedicine in creative ways. We hope it will fundamentally change the way healthcare is delivered.

We’re already far along in construction of another, larger building next to IQ that will house precision health researchers and several other new initiatives. This building, along with IQ and Radiology will create an entire area of campus dedicated to biomedical research.

Last year, we opened a new health research facility in Grand Rapids to complement our medical school there. Researchers in Grand Rapids, and our East Lansing biomedical neighborhood, will make discoveries in health science, and attract additional funding to expedite our growth trajectory. Our performance in NIH funding lags the stellar results I mentioned concerning NSF and DOE, but the investments listed above are meant to improve this situation. In addition, I should mention that for the first time MSU will have a research hospital on our campus, through a partnership with McLaren. MSU research integration with major health systems in Michigan has never been stronger, and we anticipate announcement of major collaborative efforts in the near future.

On August 31, we will break ground on a new STEM education building. New laboratory teaching and research spaces will support MSU’s increasing student enrollment in STEM fields. We look forward to the opportunities this new facility will create for both our students and faculty.

In June, construction began on a new music pavilion. This state-of-the-art facility will incorporate highly advanced acoustical engineering to create high-quality teaching, practice, rehearsal and research spaces that meet the needs of 21st century musicians. This addition further elevates our reputation in the arts, with a particular focus on student learning.

MSU will continue to invest in infrastructure improvements to support our faculty and students, increase our competitiveness, and to attract top recruits like yourselves to the university.

Another recent development is a new department called Computational Mathematics, Science, and Engineering or CMSE. This department was planned, authorized, and operational in only three years—quite a feat in academia. I often compare “startup time” (the fast pace at which things are accomplished in Silicon Valley) to “academic time” (i.e., nothing gets done, other than committee meetings, or a no-brainer project takes a decade to complete), but with CMSE this was a case of something on campus getting done in startup time. CMSE is one of very few such departments in the country -- it is focused on data science, machine learning, advanced computation and related applications, but is not a traditional CS department. It supports many of the new efforts on campus that require the analysis of large data sets and development of new tools and algorithms. Researchers in this department utilize datasets drawn from areas such as astrophysics, business analytics, mobile data, materials science, human and plant genomics, and many other areas. The department was conceived as fundamentally interdisciplinary -- bringing together experts in computation with subject matter experts in fields of science which are becoming increasingly reliant on data.

I can’t help mentioning a couple of big data examples related to my own research interests: we’ve created a compute resource with 500k human genomes from the UK Biobank, which is open to interested investigators on campus. All of the data is stored at our High Performance Computing Center or HPCC. Using this data, our collaboration demonstrated for the first time that machine learning applied to large genomic datasets could produce accurate predictors for complex human traits. We can now predict adult human height from genome alone, with accuracy of roughly 1 inch. The predictor uses ~20k genetic variants distributed throughout the genome. Predictors of complex disease risk, for conditions such as heart disease, diabetes, low blood platelet count, and breast cancer, have been developed and replicated in out-of-sample tests. See the NYTimes science section just a few days ago. This is only the beginning for genomics-informed Precision Medicine.

Over the summer, through a CEO friend in Silicon Valley, I obtained access for MSU researchers to mobile geolocation data covering the movements of over 30 million Americans. Yes, geolocation coordinates every 10 minutes or so for 30 million people, via their smartphones. I hope you all were aware of this when you clicked “I Accept” :-) If you can think of interesting research uses for this data, please contact Dirk Colbry in CMSE for more information.

The most important component of a university is not buildings, or even laboratory or compute or data infrastructure. The most important resource is people -- talented research faculty, postdocs, students, and support staff.

Some of you joining us today may have been hired under the Global Impact Initiative (GI2). Launched in 2014, the goal of GI2 is to hire 100 new faculty whose research has breakthrough potential to shape the future. Over the last four years, we’ve recruited new faculty with a focus on key areas of innovation, such as machine learning, precision medicine, computational genomics, autonomous vehicles, advanced materials, gene-editing, and advanced plant science. Nearly 80 positions have been filled, with candidates hired from Harvard, Stanford, Princeton, MIT, Johns Hopkins University, Lawrence Berkeley National Lab, Los Alamos National Lab, and many other top institutions. But we're not done yet. We look forward, with enthusiasm, to the next year of recruiting.

Working here, you will be surrounded by world-class faculty, including members of the National Academy; Guggenheim, Packard, and Sloan Fellows; a recipient of the Stockholm Water Prize; Pulitzer Prize winners; and many more.

In 2018 alone, faculty at MSU received a record 11 NSF CAREER awards across a number of disciplines including engineering, communication arts and sciences, physics and astronomy, plant science, and others. This speaks volumes about the caliber of our young faculty, and is one reason why I’m looking forward to seeing their progress.

As you begin your time here at MSU, we urge you to think big and act boldly. If you are a new faculty member, still near the beginning of your career, we want to support your growth in every way possible. If you are a senior faculty member, we want to push your research program to that next higher level of impact. And, we hope that you can provide valuable mentorship to younger scholars around you.

If there is a problem -- tell us about it! -- whether it has to do with grant submissions, or startup incubation, or child care, food options on campus, your functional or dysfunctional department. We’re here to fix things, and to provide the best possible environment for your teaching and research.

Only one in a thousand people in our society have the privilege to engage full time in discovery -- in curiosity driven research -- for the benefit of humankind. You are part of that lucky one in a thousand, and we are here to help you succeed.

The bar has been set very high, but with the resources and new opportunities here at MSU, your potential is limitless.

My very best wishes to you all :-)

Sunday, August 19, 2018

Genomic Prediction: A Hypothetical (Embryo Selection), Part 2

The figures below are from the recent paper Genome-wide polygenic scores for common diseases identify individuals with risk equivalent to monogenic mutations (Nature Genetics), discussed previously here.

As you can see, genomic prediction of risk allows to identify outliers for conditions like heart disease and diabetes. Individuals who are top 1% in polygenic risk score are many times (approaching an order of magnitude) more likely to exhibit the condition than the typical person.

In an earlier post, Genomic Prediction: A Hypothetical (Embryo Selection), I pointed out a similar situation with regard to the SSGAC predictor for Educational Attainment. Negative outliers on that polygenic score (e.g., bottom 1%) are much more likely to have difficulty in school. I then posed this hypothetical:
You are an IVF physician advising parents who have exactly 2 viable embryos, ready for implantation.

The parents want to implant only one embryo.

All genetic and morphological information about the embryos suggest that they are both viable, healthy, and free of elevated disease risk.

However, embryo A has polygenic score (as in figure above) in the lowest quintile (elevated risk of struggling in school) while embryo B has polygenic score in the highest quintile (less than average risk of struggling in school). We could sharpen the question by assuming, e.g., that embryo A has score in the bottom 1% while embryo B is in the top 1%.

You have no other statistical or medical information to differentiate between the two embryos.

What do you tell the parents? Do you inform them about the polygenic score difference between the embryos?
We can pose the analogous hypothetical for the risk scores displayed below. Should the parents be informed if, for instance, one of the embryos is in the top 1% risk for heart disease or Type 2 Diabetes? Is there a difference between the case of the EA predictor and disease risk predictors?

In the case of monogenic (Mendelian) genetic risk, e.g., Tay-Sachs, Cystic Fibrosis, BRCA, etc., deliberate genetic screening is increasingly common, even if penetrance is imperfect (i.e., the probability of the condition given the presence of the risk variant is less than 100%).

Note, the risk ratio between top 1% and bottom 1% individuals is potentially very large (see below), although more careful analysis is probably required to understand this better.

These hypotheticals will not be hypothetical for very much longer: the future is here.


(CAD = coronary artery disease.)


Tuesday, August 14, 2018

Genomic Prediction of disease risk using polygenic scores (Nature Genetics)

It seems to me we are just at the tipping point -- soon it will be widely understood that with large enough data sets we can predict complex traits and complex disease risk from genotype, capturing most of the estimated heritable variance. People will forget that many "experts" doubted this was possible -- the term missing heritability will gradually disappear.

In just a few years genotyping will start to become "standard of care" in many health systems. In 5 years there will be ~100M genotypes in storage (vs ~20M now), a large fraction available for scientific analysis.
Genome-wide polygenic scores for common diseases identify individuals with risk equivalent to monogenic mutations (Nature Genetics)

A key public health need is to identify individuals at high risk for a given disease to enable enhanced screening or preventive therapies. Because most common diseases have a genetic component, one important approach is to stratify individuals based on inherited DNA variation1. Proposed clinical applications have largely focused on finding carriers of rare monogenic mutations at several-fold increased risk. Although most disease risk is polygenic in nature2,3,4,5, it has not yet been possible to use polygenic predictors to identify individuals at risk comparable to monogenic mutations. Here, we develop and validate genome-wide polygenic scores for five common diseases. The approach identifies 8.0, 6.1, 3.5, 3.2, and 1.5% of the population at greater than threefold increased risk for coronary artery disease, atrial fibrillation, type 2 diabetes, inflammatory bowel disease, and breast cancer, respectively. For coronary artery disease, this prevalence is 20-fold higher than the carrier frequency of rare monogenic mutations conferring comparable risk6. We propose that it is time to contemplate the inclusion of polygenic risk prediction in clinical care, and discuss relevant issues.
See also Genomic Prediction: A Hypothetical (Embryo Selection) and Accurate Genomic Prediction Of Human Height.

From the paper:
Using much larger studies and improved algorithms, we set out to revisit the question of whether a GPS can identify subgroups of the population with risk approaching or exceeding that of a mono- genic mutation. We studied five common diseases with major public health impact: CAD, atrial fibrillation, type 2 diabetes, inflamma- tory bowel disease, and breast cancer.

For each of the diseases, we created several candidate GPSs based on summary statistics and imputation from recent large GWASs in participants of primarily European ancestry (Table 1). Specifically, we derived 24 predictors based on a pruning and thresholding method, and 7 additional predictors using the recently described LDPred algorithm13 (Methods, Fig. 1 and Supplementary Tables 1–6). These scores were validated and tested within the UK Biobank, which has aggregated genotype data and extensive phenotypic information on 409,258 participants of British ancestry (average age: 57 years; 55% female)14,15.

We used an initial validation dataset of the 120,280 participants in the UK Biobank phase 1 genotype data release to select the GPSs with the best performance, defined as the maximum area under the receiver-operator curve (AUC). We then assessed the performance in an independent testing dataset comprised of the 288,978 partici- pants in the UK Biobank phase 2 genotype data release. For each disease, the discriminative capacity within the testing dataset was nearly identical to that observed in the validation dataset.

In the talk below @21:45 I discuss prospects for genomic prediction of disease risk.


Wednesday, August 08, 2018

Life and Fate, Before Sunset


This Hollywood oral history tells the story of Richard Linklater's "Before" Trilogy: Before Sunrise, Before Sunset, and Before Midnight. The films appeared 9 years apart, and tell the story of Jesse (Ethan Hawke) and Celine (Julie Delpy) in their 20s, 30s, and 40s. I find the second film to be the most interesting, really a masterpiece of filmmaking (I have a copy on the hard drive of the laptop I write this on :-). The events in Before Sunset take place in real time -- i.e., the story transpires over the run time of the movie, a single afternoon. Shooting it must have been extremely challenging for Delpy and Hawke, and for the crew.

The video above should start at 23:30, and explains how Linklater, Delpy, and Hawke came together to do the sequel. I think that event was, in some sense, the most contingent of those responsible for the trilogy. The first movie made very little money, and hence the idea to make a second, very different film -- about the complexity of life, the passage of time, lost chances -- was neither obvious nor inevitable.

The first movie is about a one night tryst between 20-something travelers, but the second movie takes place a decade later. The protagonists, while still young, have experienced more of life and the second film is richer and more complex, despite taking place over an even shorter period of time. I remember being excited to see it, not so much because of Before Sunrise (which I found entertaining, but not as special), but because of the intriguing premise of two lovers meeting again by chance after losing track of each other for so long.

Here's a scene from Before Sunset: a long take of walking and conversation in beautiful Paris, camera following Hawke and Delpy in a totally naturalistic way.


I hesitate to include this trailer because it's kind of cheesy, but if you're not familiar with the trilogy it explains the premise of the first two films.


The video below is a nice discussion of the trilogy. Just now I learned (thanks, AI!) that Before Sunrise is based on actual events in Linklater's life -- see here for the poignant story of the real life muse for these films.


Richard Linklater also directed Dazed and Confused -- one of the greatest high school movies ever made, and a beautiful evocation of adolescence in late-70s, early-80s America.

Saturday, August 04, 2018

Assassination by Drone

I have been waiting for this to happen:
Reuters: CARACAS - Drones loaded with explosives detonated close to a military event where Venezuelan President Nicolas Maduro was giving a speech on Saturday, but he and top government officials alongside him escaped unharmed from what Information Minister Jorge Rodriguez called an “attack” targeting the leftist leader. Seven National Guard soldiers were injured, Rodriguez added.
See this 2015 post on drone racing and ask yourself how you'd stop one of these drones from getting close to its target.

Countermeasures will be quite difficult, especially if drone operators use sophisticated frequency hopping control.

One doesn't even need pilot operators. The drones can be programmed to fly to a GPS coordinate using an evasive approach.

1. The exact coordinate can be marked by someone in the audience of a public appearance of the target.

2. It would be a formidable challenge even to stop some medium sized drones, each with a few kilo payload, from flying through the windows of the Oval Office (known GPS coordinate; known presence of targets at specific times).


This is still Science Fiction, for now:


Twenty years ago I told a PhD student that a terrorist -- willing to die and able to fly an airplane -- could probably take out the White House. After 9/11 he reminded me that I had identified this hole in the system well in advance. It's the same thing here with small and medium size drones. They are accessible to non-state actors with limited resources, and very difficult to defeat, even for state security.

Barista Bots


Still think low-skill immigration is a good idea?

If you accept the thesis that automation is a threat to low-skill employment, then you should be willing to reconsider the long term cost-benefit analysis of low-skill immigration.

Thursday, August 02, 2018

Arnold: The Will to Power


I don't know whether Arnold ever read Nietzsche, but he certainly developed the Will to Power early in life. I quite like the video above -- I even made my kids watch it :-)

When I was in high school I came across his book Arnold: The Education of a Bodybuilder, a combination autobiography and training manual published in 1977. I found a copy in the remainder section of the book store and bought it for a few dollars. The most interesting part of the book is the description of his early life in Austria and his introduction to weightlifting and bodybuilding. I highly recommend it to anyone interested in golden age bodybuilding, the early development of physical training, or the psychology of human drive and high achievement. Young Arnold displays a kind of unbridled and unironic egoism that can no longer be expressed without shame in today's feminized society.


Chapter 2: Before long, people began looking at me as a special person. Partly this was the result of my own changing attitude about myself. I was growing, getting bigger, gaining confidence. I was given consideration I had never received before; it was as though I were the son of a millionaire. I'd walk into a room at school and my classmates would offer me food or ask if they could help me with my homework. Even my teachers treated me differently. Especially after I started winning trophies in the weight-lifting contests I entered.

This strange new attitude toward me had an incredible effect on my ego. It supplied me with something I had been craving. I'm not sure why I had this need for special attention. Perhaps it was because I had an older brother who'd received more than his share of attention from our father. Whatever the reason, I had a strong desire to be noticed, to be praised. I basked in this new flood of attention. I turned even negative responses to my own satisfaction.

I'm convinced most of the people I knew didn't really understand what I was doing at all. They looked at me as a novelty, a freak. ...

"Why did you have to pick the least-favorite sport in Austria?" they always asked. It was true. We had only twenty or thirty bodybuilders in the entire country. I couldn't come up with an answer. I didn't know. It had been instinctive. I had just fallen in love with it. I loved the feeling of the gym, of working out, of having muscles all over.

Now, looking back, I can analyze it more clearly. My total involvement had a lot to do with the discipline, the individualism, and the utter integrity of bodybuilding. But at the time it was a mystery even to me. Bodybuilding did have its rewards, but they were relatively small. I wasn't competing yet, so my gratification had to come from other areas. In the summer at the lake I could surprise everyone by showing up with a different body. They'd say, "Jesus, Arnold, you grew again. When are you going to stop?"

"Never," I'd tell them. We'd all laugh. They thought it amusing. But I meant it.

...

The strangest thing was how my new body struck girls. There were a certain number of girls who were knocked out by it and a certain number who found it repulsive. There was absolutely no in-between. It seemed cut and dried. I'd hear their comments in the hallway at lunchtime, on the street, or at the lake. "I don't like it. He's weird—all those muscles give me the creeps." Or, "I love the way Arnold looks—so big and powerful. It's like sculpture. That's how a man should look."

These reactions gave me added motivation to continue building my body. I wanted to get bigger so I could really impress the girls who liked it and upset the others even more. Not that girls were my main reason for training. Far from it. But they added incentive and I figured as long as I was getting this attention from them I might as well use it. I had fun. I could tell if a girl was repelled by my size. And when I'd catch her looking at me in disbelief, I would casually raise my arm, flex my bicep, and watch her cringe. It was always good for a laugh. ...
Arnold, age 17 or 18:

Friday, July 27, 2018

Insight Podcast: James Lee interview on SSGAC EA3


Spencer Wells and Razib Khan interview James Lee (Professor of Psychology, University of Minnesota, BA Berkeley, PhD Harvard) about the recent SSGAC EA3 GWAS.

Comment: James mentions that EA3 may be approaching the GCTA h2 limit (~0.15? so limiting r ~ 0.4) already. But the limit for actual cognitive ability is much higher; with enough data I think we could get to r ~ 0.6 or even r ~ 0.7 eventually for common SNPs -- similar to height.

United Club, HK International Airport


James, me, Chris Chang. (About $1M worth of Illumina HiSeqs in crates behind us?)


Wednesday, July 25, 2018

Genomic Prediction: A Hypothetical (Embryo Selection)

The new SSGAC EA3 paper in Nature Genetics contains the following figure.


Add Health (National Longitudinal Study of Adolescent to Adult Health) and HRS (Health in Retirement Study) are two longitudinal cohorts under study by social scientists. Horizontal axis is polygenic score (computed from DNA alone). It appears that individuals with top quintile polygenic scores are about 5 times more likely to complete college than bottom quintile individuals.  (IIUC, HRS cohort grew up in an earlier era when college attendance rates were lower; Add Health participants are younger.)

Consider the following hypothetical:
You are an IVF physician advising parents who have exactly 2 viable embryos, ready for implantation. The parents want to implant only one embryo. 
All genetic and morphological information about the embryos suggest that they are both viable, healthy, and free of elevated disease risk.

However, embryo A has polygenic score (as in figure above) in the lowest quintile (elevated risk of struggling in school) while embryo B has polygenic score in the highest quintile (less than average risk of struggling in school). We could sharpen the question by assuming, e.g., that embryo A has score in the bottom 1% while embryo B is in the top 1%.

You have no other statistical or medical information to differentiate between the two embryos.

What do you tell the parents? Do you inform them about the polygenic score difference between the embryos?
Note, in the very near future this question will no longer be hypothetical...

See Nativity 2050 and The Future is Here: Genomic Prediction in MIT Technology Review.

Monday, July 23, 2018

SSGAC EA3: genomic prediction of educational attainment and related cognitive phenotypes

Years ago I predicted that:

1. Cognitive ability would turn out to be influenced by many thousands of genetic variants, each of small effect.

2. With large enough sample size we would detect these variants and eventually construct genomic predictors.

The Nature Genetics paper below from the SSGAC collaboration takes a significant step in that direction.

Although the study used over a million genotypes, the data had to be aggregated across many sub-cohorts using summary statistics only. This does not permit the L1-penalized optimization we used to build our height predictor.

For out of sample validation of the results below, see this PNAS paper, which (unusually) appeared before the paper on which it is based.

The lead author James Lee is on the left below. Chris Chang, author of Plink 2.0, is on the right. The photo was taken in 2010 at BGI -- they are standing in front of crates of Illumina sequencers.


Article | Published: 23 July 2018

Gene discovery and polygenic prediction from a genome-wide association study of educational attainment in 1.1 million individuals

James J. Lee, Robbee Wedow, […]David Cesarini
Nature Genetics (2018)

Abstract
Here we conducted a large-scale genetic association analysis of educational attainment in a sample of approximately 1.1 million individuals and identify 1,271 independent genome-wide-significant SNPs. For the SNPs taken together, we found evidence of heterogeneous effects across environments. The SNPs implicate genes involved in brain-development processes and neuron-to-neuron communication. In a separate analysis of the X chromosome, we identify 10 independent genome-wide-significant SNPs and estimate a SNP heritability of around 0.3% in both men and women, consistent with partial dosage compensation. A joint (multi-phenotype) analysis of educational attainment and three related cognitive phenotypes generates polygenic scores that explain 11–13% of the variance in educational attainment and 7–10% of the variance in cognitive performance. This prediction accuracy substantially increases the utility of polygenic scores as tools in research.
A nice figure from the paper: Add Health (National Longitudinal Study of Adolescent to Adult Health) and HRS (Health in Retirement Study) are two longitudinal cohorts that have been genotyped; horizontal axis is polygenic score. It appears that individuals with top quintile polygenic scores are about 5 times more likely to complete college than bottom quintile individuals.


Here's a comment on the paper I provided to a journalist:
The EA3 predictor correlates about 0.35 with educational attainment, and slightly less well with measured cognitive ability. While this is far from perfect prediction, it does allow identification of individuals, using DNA alone, who are at unusual risk of being well below average in cognitive ability or struggling in school. Standardized tests, such as SAT, ACT, GRE, LSAT, etc., typically also correlate roughly 0.35 with educational outcomes like grade point average, degree completion, etc. In this sense, the genomic predictor is comparable to widely used tests and it will certainly improve as more data are analyzed. See figure.

Sunday, July 22, 2018

LATTICE 2018 at MSU


The 36th Annual International Symposium on Lattice Field Theory begins tomorrow, hosted by MSU. My opening remarks are below. No peeking if you are an attendee!
LATTICE 2018 Opening Remarks 7/23/2018

Good morning. I’d like to extend my warmest welcome to all of you on behalf of Michigan State University. We are very pleased and honored to be the hosts for The 36th Annual International Symposium on Lattice Field Theory.

It is my opinion that even within Physics, and even within Theoretical Physics, Lattice Field Theory is underappreciated. The idea that we can constructively realize quantum field theories in silico, that we can perform precision calculations in the deepest models of fundamental physics, is really incredible. It has taken many decades to get to this point: to master strongly coupled quantum fluctuations, spacetime trajectories of quantum fields like quarks and gluons, advanced algorithms and hardware designs, matching to effective field theories, and many other conceptually beautiful but ultimately concrete things.

Along with some recent AI advances like AlphaGo, the precise ab initio calculation of physical quantities in lattice QCD must be considered among the most impressive computations performed by the human species. If some Alien visitors were evaluating the accomplishments of our civilization, I would want them to take into account the work of people here today.

I first became aware of lattice gauge theory from John Preskill’s lecture notes for Physics 234, a year-long Caltech course on advanced topics in QCD. I never imagined, back in the 1980s, the successes that all of you have achieved today. The important message to young people is that one should not be dissuaded from attempting difficult projects.

At MSU we made the decision a few years ago to invest in lattice physics. We went from no lattice researchers, to one of the larger groups in the US. One of the drivers for this decision was the hope that lattice simulations would one day connect QCD to the experimental results coming from FRIB -- the MSU / DOE Facility for Rare Isotope Beams. Today we can compute, from first principles, the properties of light hadrons. In the coming decades, I believe we will compute real time scattering amplitudes and nuclear forces from QCD itself.

DOE and MSU are investing, all told, roughly a billion dollars in FRIB. While it is the Experimentalists who build and run the machine, and deserve the main credit, we as Theorists have the responsibility to ensure that the results of the experiment inform our deeper understanding of nuclear physics and QCD. Physicists are not stamp collectors -- we do not measure things just to measure them. We measure things which are important and have deep implications.

To reach the long awaited goal of connecting nuclear physics directly to QCD, we depend on the lattice community, on all of you. May the next 30 years see as much progress as the last.

Thank you very much.

Action photos!


London Calling

On my way home from Stockholm / ICML I stopped in London to see my friend Dominic Cummings, give a talk at ASI Data Science, and have some Oligarch meetings. Sorry I can't share more details.

Here are some photos from the British Museum.


Bodhisattva: a person who is able to reach nirvana but delays doing so out of compassion in order to save suffering beings.
“Tenfold be your damnation," he said.. "There shall be no rebirth."

His hands came open then. A tall, nobly proportioned man lay upon the floor at his feet, his head resting upon his right shoulder.

His eye had finally closed.

Yama turned the corpse with the toe of his boot. "Build a pyre and burn this body," he said to the monks, not turning toward them. "Spare none of the rites. One of the highest has died this day.”

Lord of Light, Roger Zelazny.

Tuesday, July 17, 2018

ICML notes

It's never been a better time to work on AI/ML. Vast resources are being deployed in this direction, by corporations and governments alike. In addition to the marvelous practical applications in development, a theoretical understanding of Deep Learning may emerge in the next few years.

The notes below are to keep track of some interesting things I encountered at the meeting.

Some ML learning resources:

Metacademy
Depth First study of AlphaGo


I heard a more polished version of this talk by Elad at the Theory of Deep Learning workshop. He is trying to connect results in sparse learning (e.g., performance guarantees for L1 or threshold algos) to Deep Learning. (Video is from UCLA IPAM.)


It may turn out that the problems on which DL works well are precisely those in which the training data (and underlying generative processes) have a hierarchical structure which is sparse, level by level. Layered networks perform a kind of coarse graining (renormalization group flow): first layers filter by feature, subsequent layers by combinations of features, etc. But the whole thing can be understood as products of sparse filters, and the performance under training is described by sparse performance guarantees (ReLU = thresholded penalization?). Given the inherent locality of physics (atoms, molecules, cells, tissue; atoms, words, sentences, ...) it is not surprising that natural phenomena generate data with this kind of hierarchical structure.


Off-topic: At dinner with one of my former students and his colleague (both researchers at an AI lab in Germany), the subject of Finitism came up due to a throwaway remark about the Continuum Hypothesis.

Wikipedia
Horizons of Truth
Chaitin on Physics and Mathematics

David Deutsch:
The reason why we find it possible to construct, say, electronic calculators, and indeed why we can perform mental arithmetic, cannot be found in mathematics or logic. The reason is that the laws of physics "happen" to permit the existence of physical models for the operations of arithmetic such as addition, subtraction and multiplication.
My perspective: We experience the physical world directly, so the highest confidence belief we have is in its reality. Mathematics is an invention of our brains, and cannot help but be inspired by the objects we find in the physical world. Our idealizations (such as "infinity") may or may not be well-founded. In fact, mathematics with infinity included may be very sick, as evidenced by Godel's results, or paradoxes in set theory. There is no reason that infinity is needed (as far as we know) to do physics. It is entirely possible that there are only a (large but) finite number of degrees of freedom in the physical universe.

Paul Cohen:
I will ascribe to Skolem a view, not explicitly stated by him, that there is a reality to mathematics, but axioms cannot describe it. Indeed one goes further and says that there is no reason to think that any axiom system can adequately describe it.
This "it" (mathematics) that Cohen describes may be the set of idealizations constructed by our brains extrapolating from physical reality. But there is no guarantee that these idealizations have a strong kind of internal consistency and indeed they cannot be adequately described by any axiom system.

Monday, July 09, 2018

Game Over: Genomic Prediction of Social Mobility

[ NOTE: The PNAS paper discussed below uses the SSGAC EA3 genomic predictor, trained on over a million genomes. The EA3 paper has now appeared in Nature Genetics. ]

The figure below shows SNP-based polygenic score and life outcome (socioeconomic index, on vertical axis) in four longitudinal cohorts, one from New Zealand (Dunedin) and three from the US. Each cohort (varying somewhat in size) has thousands of individuals, ~20k in total (all of European ancestry). The points displayed are averages over bins containing 10-50 individuals. For each cohort, the individuals have been grouped by childhood (family) social economic status. Social mobility can be predicted from polygenic score. Note that higher SES families tend to have higher polygenic scores on average -- which is what one might expect from a society that is at least somewhat meritocratic. The cohorts have not been used in training -- this is true out-of-sample validation. Furthermore, the four cohorts represent different geographic regions (even, different continents) and individuals born in different decades.

Everyone should stop for a moment and think carefully about the implications of the paragraph above and the figure below.


Caption from the PNAS paper.
Fig. 4. Education polygenic score associations with social attainment for Add Health Study, WLS, Dunedin Study, and HRS participants with low-, middle-, and high-socioeconomic status (SES) social origins. The figure plots polygenic score associations with socioeconomic attainment for Add Health Study (A), Dunedin Study (B), WLS (C), and HRS (D) participants who grew up in low-, middle-, and high-SES households. For the figure, low- middle-, and high-SES households were defined as the bottom quartile, middle 50%, and top quartile of the social origins score distributions for the Add Health Study, WLS, and HRS. For the Dunedin Study, low SES was defined as a childhood NZSEI of two or lower (20% of the sample), middle SES was defined as childhood NZSEI of three to four (63% of the sample), and high SES was defined as childhood NZSEI of five or six (17% of the sample). Attainment is graphed in terms of socioeconomic index scores for the Add Health Study, Dunedin Study, and WLS and in terms of household wealth in the HRS. Add Health Study and WLS socioeconomic index scores were calculated from Hauser and Warren (34) occupational income and occupational education scores. Dunedin Study socioeconomic index scores were calculated similarly, according to the Statistics New Zealand NZSEI (38). HRS household wealth was measured from structured interviews about assets. All measures were z-transformed to have mean = 0, SD = 1 for analysis. The individual graphs show binned scatterplots in which each plotted point reflects average x and y coordinates for a bin of 50 participants for the Add Health Study, WLS, and HRS and for a bin of 10 participants for the Dunedin Study. The red regression lines are plotted from the raw data. The box-and-whisker plots at the bottom of the graphs show the distribution of the education polygenic score for each childhood SES category. The blue diamond in the middle of the box shows the median; the box shows the interquartile range; and the whiskers show upper and lower bounds defined by the 25th percentile minus 1.5× the interquartile range and the 75th percentile plus 1.5× the interquartile range, respectively. The vertical line intersecting the x axis shows the cohort average polygenic score. The figure illustrates three findings observed consistently across cohorts: (i) participants who grew up in higher-SES households tended to have higher socioeconomic attainment independent of their genetics compared with peers who grew up in lower-SES households; (ii) participants’ polygenic scores were correlated with their social origins such that those who grew up in higher-SES households tended to have higher polygenic scores compared with peers who grew up in lower-SES households; (iii) participants with higher polygenic scores tended to achieve higher levels of attainment across strata of social origins, including those born into low-SES families.

The paper:
Genetic analysis of social-class mobility in five longitudinal studies, Belsky et al.

PNAS July 9, 2018. 201801238; published ahead of print July 9, 2018. https://doi.org/10.1073/pnas.1801238115

A summary genetic measure, called a “polygenic score,” derived from a genome-wide association study (GWAS) of education can modestly predict a person’s educational and economic success. This prediction could signal a biological mechanism: Education-linked genetics could encode characteristics that help people get ahead in life. Alternatively, prediction could reflect social history: People from well-off families might stay well-off for social reasons, and these families might also look alike genetically. A key test to distinguish biological mechanism from social history is if people with higher education polygenic scores tend to climb the social ladder beyond their parents’ position. Upward mobility would indicate education-linked genetics encodes characteristics that foster success. We tested if education-linked polygenic scores predicted social mobility in >20,000 individuals in five longitudinal studies in the United States, Britain, and New Zealand. Participants with higher polygenic scores achieved more education and career success and accumulated more wealth. However, they also tended to come from better-off families. In the key test, participants with higher polygenic scores tended to be upwardly mobile compared with their parents. Moreover, in sibling-difference analysis, the sibling with the higher polygenic score was more upwardly mobile. Thus, education GWAS discoveries are not mere correlates of privilege; they influence social mobility within a life. Additional analyses revealed that a mother’s polygenic score predicted her child’s attainment over and above the child’s own polygenic score, suggesting parents’ genetics can also affect their children’s attainment through environmental pathways. Education GWAS discoveries affect socioeconomic attainment through influence on individuals’ family-of-origin environments and their social mobility.

Note Added from comments: Plots would look much noisier if not for averaging many individuals into single point. Keep in mind that socioeconomic success depends on a lot more than just cognitive ability, or even cognitive ability + conscientiousness.

But, underlying predictor correlates ~0.35 with actual educational attainment, IIRC. That is, the polygenic score predicts EA about as well as standardized tests predict success in schooling.

This means you can at least use it to identify outliers: just as a very high/low test score (SAT, ACT, GRE) does not *guarantee* success/failure in school, nevertheless the signal is useful for selection = admissions.

Friday, July 06, 2018

Seven Years, Two Tweets

Is anyone keeping score?

See On the Genetic Architecture of Cognitive Ability (2014) and Nautilus Magazine: Super Intelligent Humans.


Thursday, July 05, 2018

Cognitive ability predicted from fMRI (Caltech Neuroscience)

Caltech researchers used elastic net (L1 and L2 penalization) to train a predictor using cognitive scores and fMRI data from ~900 individuals. The predictor captures about 20% of variance in intelligence; the score correlates a bit more than 0.45 with actual intelligence. This may validate earlier work by Korean researchers in 2015, although the Korean group claimed much higher predictive correlations.

Press release:
In a new study, researchers from Caltech, Cedars-Sinai Medical Center, and the University of Salerno show that their new computing tool can predict a person's intelligence from functional magnetic resonance imaging (fMRI) scans of their resting state brain activity. Functional MRI develops a map of brain activity by detecting changes in blood flow to specific brain regions. In other words, an individual's intelligence can be gleaned from patterns of activity in their brain when they're not doing or thinking anything in particular—no math problems, no vocabulary quizzes, no puzzles.

"We found if we just have people lie in the scanner and do nothing while we measure the pattern of activity in their brain, we can use the data to predict their intelligence," says Ralph Adolphs (PhD '92), Bren Professor of Psychology, Neuroscience, and Biology, and director and Allen V. C. Davis and Lenabelle Davis Leadership Chair of the Caltech Brain Imaging Center.

To train their algorithm on the complex patterns of activity in the human brain, Adolphs and his team used data collected by the Human Connectome Project (HCP), a scientific endeavor funded by the National Institutes of Health (NIH) that seeks to improve understanding of the many connections in the human brain. Adolphs and his colleagues downloaded the brain scans and intelligence scores from almost 900 individuals who had participated in the HCP, fed these into their algorithm, and set it to work.

After processing the data, the team's algorithm was able to predict intelligence at statistically significant levels across these 900 subjects, says Julien Dubois (PhD '13), a postdoctoral fellow at Cedars-Sinai Medical Center. But there is a lot of room for improvement, he adds. The scans are coarse and noisy measures of what is actually happening in the brain, and a lot of potentially useful information is still being discarded.

"The information that we derive from the brain measurements can be used to account for about 20 percent of the variance in intelligence we observed in our subjects," Dubois says. "We are doing very well, but we are still quite far from being able to match the results of hour-long intelligence tests, like the Wechsler Adult Intelligence Scale,"

Dubois also points out a sort of philosophical conundrum inherent in the work. "Since the algorithm is trained on intelligence scores to begin with, how do we know that the intelligence scores are correct?" The researchers addressed this issue by extracting a more precise estimate of intelligence across 10 different cognitive tasks that the subjects had taken, not only from an IQ test. ...
Paper:
A distributed brain network predicts general intelligence from resting-state human neuroimaging data

Individual people differ in their ability to reason, solve problems, think abstractly, plan and learn. A reliable measure of this general ability, also known as intelligence, can be derived from scores across a diverse set of cognitive tasks. There is great interest in understanding the neural underpinnings of individual differences in intelligence, since it is the single best predictor of long-term life success, and since individual differences in a similar broad ability are found across animal species. The most replicated neural correlate of human intelligence to date is total brain volume. However, this coarse morphometric correlate gives no insights into mechanisms; it says little about function. Here we ask whether measurements of the activity of the resting brain (resting-state fMRI) might also carry information about intelligence. We used the final release of the Young Adult Human Connectome Project dataset (N=884 subjects after exclusions), providing a full hour of resting-state fMRI per subject; controlled for gender, age, and brain volume; and derived a reliable estimate of general intelligence from scores on multiple cognitive tasks. Using a cross-validated predictive framework, we predicted 20% of the variance in general intelligence in the sampled population from their resting-state fMRI data. Interestingly, no single anatomical structure or network was responsible or necessary for this prediction, which instead relied on redundant information distributed across the brain.

Tuesday, July 03, 2018

In the land of the Gene Titans

Apologies for the lack of posts recently. I've been traveling and busy with meetings. For my own recollection, here is a partial list of places I've been in the past weeks.

Illumina (San Diego)
Ancestry (~10M genomes! San Francisco)
23andMe (~5M genomes! Mountain View)
OpenAI (machines beat pro human teams in complex Dota 2 game! San Francisco)
Affymetrix (Santa Clara)
Healdsburg, Sonoma (Talk at meeting of Oligarchs :-)
Soros Fund Management (Talk at leadership retreat, Museum of Arts and Design, NYC)


These GeneTitans are part of the Affy lab that did all of the genotyping for the UK Biobank project. The footprint for this kind of lab is shockingly small: ~6k samples per week per machine and ~10 machines means millions of individual genotypes per year. Illumina produces similar arrays/readers and a hundred square meters of lab space is enough to process millions of samples per year for DTC genomics companies like 23andMe and Ancestry.

We may have a lab like this soon at MSU ;-)

Thursday, June 21, 2018

Harvard Office of Institutional Research models: explicit racial penalty required to reproduce actual admit rates for Asian-Americans

This is my third post discussing the Students For Fair Admissions lawsuit against Harvard over discrimination against Asian-American applicants. Earlier posts here and here discussed, among other things, the tendency of the Admissions Office to assign low personal ratings to A-A applicants. A-As received, on average, the lowest such ratings among all ethnic groups from the Admissions Office. In contrast, alumni interviewers (who actually met the candidates) gave A-A applicants scores comparable to white applicants, and higher than other ethnic groups.

Harvard's Office of Institutional Research (OIR) produced a series of internal reports on discrimination against Asian-American applicants, beginning in 2013. They attempted to model the admissions process, and concluded there was outright penalization of A-A applicants:
Mark Hansen, the (now former) OIR employee, remembers far more. He remembers working with others in OIR on the project. He remembers gathering data, conducting the regression analysis, collaborating with colleagues, coordinating with the Admissions Office, and discussing the results of OIR’s investigation with Fitzsimmons and others on multiple occasions.  Hansen expressed no concerns with the quality and thoroughness of OIR’s statistical work. Moreover, he has a clear understanding of the implications of OIR’s findings. Hansen testified that the reports show that Asian Americans “are disadvantaged in the admissions process at Harvard.” And when asked: “Do you have any explanation other than intentional discrimination for your conclusions regarding the negative association between Asians and the Harvard admissions process?” Hansen responded: “I don’t.”
The figures below show several OIR models which try to fit the observed admit rates for various groups. The only model that comes close (Model 4) is one which assigns outright penalties to A-A applicants (using "demographic" -- i.e., explicitly racial -- factors). IIUC, this is *after* the low Personal Rating scores from the Admissions Office have already been accounted for!

In the decades leading up to the data discovery forced by the SFFA lawsuit, we heard many claims that legacy / recruited athlete status, or leadership characteristics, or extracurriculars, were the reasons for A-As having such a low acceptance rate (despite their strong academic records). The OIR analysis shows that these effects, while perhaps real, are only part of the story. In Model 4, pure racial bias reduces the A-A percentage of the entering class from 26% (after accounting for all the factors listed above) to the actual 18-19%!


Tuesday, June 19, 2018

Harvard Office of Institutional Research on Discrimination Against Asian-American Applicants

Harvard's Office of Institutional Research (OIR) produced a series of internal reports on discrimination against Asian-American applicants, beginning in 2013. I believe this was in response to Ron Unz's late 2012 article The Myth of American Meritocracy. These reports were shared with, among others, William Fitzsimmons (Dean of Admissions and Financial Aid) and Rakesh Khurana (Dean of Harvard College). Faced with an internal investigation showing systemic discrimination against Asian-American applicants, Harvard killed the study and quietly buried the reports. The Students For Fair Admissions (SFFA) supporting memo for Summary Judgment contains excerpts from depositions of these and other Harvard leaders concerning the internal reports. (Starting p.15 -- SAD!)

The second report included the figure below. Differences are in SDs, Asian = Asian-American (International applicants are distinct category), and Legacy and Recruited Athlete candidates have been excluded for this calculation.


As discussed in the previous post: When it comes to the score assigned by the Admissions Office, Asian-American applicants are given the lowest scores of any racial group. ... By contrast, alumni interviewers (who actually meet the applicants) rate Asian-Americans, on average, at the top with respect to personal ratings—comparable to white applicants ...

From the SFFA (Students For Fair Admissions) supporting memo for summary judgement:
OIR found that Asian-American admit rates were lower than white admit rates every year over a ten-year period even though, as the first of these two charts shows, white applicants materially outperformed Asian-American applicants only in the personal rating. Indeed, OIR found that the white applicants were admitted at a higher rate than their Asian-American counterparts at every level of academic-index level. But it is even worse than that. As the second chart shows, being Asian American actually decreases the chances of admissions. Like Professor Arcidiacono, OIR found that preferences for African American and Hispanic applicants could not explain the disproportionately negative effect Harvard’s admission system has on Asian Americans.
On David Card's obfuscatory analysis: the claim is that within the pool of "unhooked" applicants (excluding recruited athletes, legacies, children of major donors, etc.), Asian-Americans are discriminated against. Card's analysis obscures this point.
The task here is to determine whether “similarly situated” applicants have been treated differently on the basis of race; “apples should be compared to apples.” SBT Holdings, LLC v. Town of Westminster, 547 F.3d 28, 34 (1st Cir. 2008). Because certain applicants are in a special category, it is important to analyze the effect of race without them included. Excluding them allows for the effect of race to be tested on the bulk of the applicant pool (more than 95% of applicants and more than two-thirds of admitted students) that do not fall into one of these categories, i.e., the similarly situated applicants. For special-category applicants, race either does not play a meaningful role in their chances of admission or the discrimination is offset by the “significant advantage” they receive. Either way, they are not apples.

Professor Card’s inclusion of these applicants reflects his position that “there is no penalty against Asian-American applicants unless Harvard imposes a penalty on every Asian-American applicant.” But he is not a lawyer and he is wrong. It is illegal to discriminate against any Asian-American applicant or subset of applicants on the basis of race. Professor Card cannot escape that reality by trying to dilute the dataset. The claim here is not that Harvard, for example, “penalizes recruited athletes who are Asian-American because of their race.” The claim “is that the effects of Harvard’s use of race occur outside these special categories.” Professor Arcidiacono thus correctly excluded special-category applicants to isolate and highlight Harvard’s discrimination against Asian Americans. Professor Card, by contrast, includes “special recruiting categories in his models” to “obscure the extent to which race is affecting admissions decisions for those not fortunate enough to belong to one of these groups.” At bottom, SFFA’s claim is that Harvard penalizes Asian-American applicants who are not legacies or recruited athletes. Professor Card has shown that he is unwilling and unable to contest that claim.
This is an email from an alumni interviewer:
[M]y feelings towards Harvard have been slowly changing over the years. I’ve been interviewing for the college for almost 10 years now, and in those ten years, none of the Asian American students I’ve interviewed has been accepted (or even wait-listed). I’m 0 for about 20. This is the case despite the fact that their resumes are unbelievable and often superior to those of the non-Asian students I’ve interviewed who are admitted. I’ve also attended interviewer meetings where Asian candidates are summarily dismissed as “typical” or “not doing anything anyone else isn’t doing” while white or other minority candidates with similar resumes are lauded.
From p.18 of the SFFA memo:
Mark Hansen, the (now former) OIR employee, remembers far more. He remembers working with others in OIR on the project. He remembers gathering data, conducting the regression analysis, collaborating with colleagues, coordinating with the Admissions Office, and discussing the results of OIR’s investigation with Fitzsimmons and others on multiple occasions.  Hansen expressed no concerns with the quality and thoroughness of OIR’s statistical work. Moreover, he has a clear understanding of the implications of OIR’s findings. Hansen testified that the reports show that Asian Americans “are disadvantaged in the admissions process at Harvard.” And when asked: “Do you have any explanation other than intentional discrimination for your conclusions regarding the negative association between Asians and the Harvard admissions process?” Hansen responded: “I don’t.”
A very sad tweet:

Blog Archive

Labels